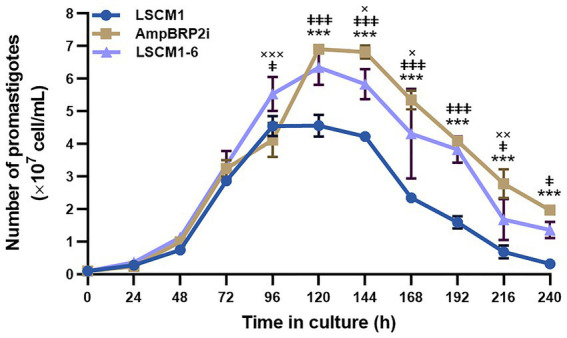
Figure 2.

Growth curves of the L. martiniquensis LSCM1, AmpBRP2i, and LSCM1-6 promastigotes cultured in the SIM supplemented with 10% (v/v) hiFBS and 25 μg/ml gentamycin sulfate, pH 6.8 at 26°C. All parasites were inoculated at 1×10⁶ parasites from stationary growth phase/mL and were counted daily until day 10 (240 h). Statistically significant differences between LSCM1 and AmpBRP2i are indicated as *** = p < 0.001; LSCM1 and LSCM1-6 are indicated as ǂǂǂ = p < 0.001, ǂǂ = p < 0.01, and ǂ = p < 0.05; AmpBPR2i and LSCM1-6 are indicated as ××× = p < 0.001 and ×× = p < 0.01, and × = p < 0.05.
