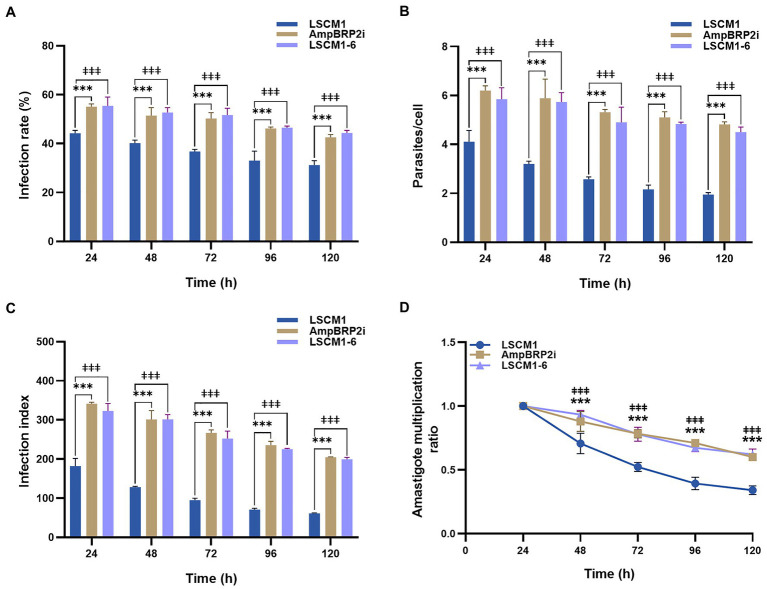
Figure 4.
PEMs were infected using stationary phase promastigotes after 120 h of culture at a multiplicity of infection (MOI) = 1:10. (A) Percentage of infected cells measured from 24 to 120 h post-infection. (B) Average number of parasites per macrophage. (C) Infection index calculated by multiplying the percentage of infected macrophages by the average number of parasites per macrophage. (D) Amastigote multiplication ratio calculated from the average number of intracellular amastigotes at Tx divided by the average number of intracellular amastigotes at T0 (Chanmol et al., 2019). Results are expressed as the means±SD from three different experiments run in duplicate. Statistically significant differences between LSCM1 and AmpBRP2i are indicated as *** = p < 0.001; between LSCM1 and LSCM1-6 are indicated as ǂǂǂ = p < 0.001.

