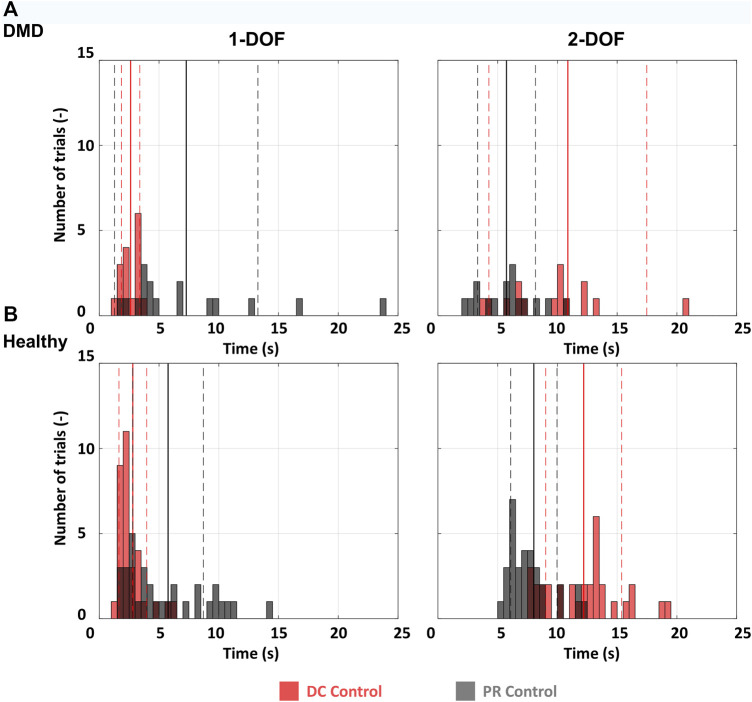
FIGURE 3.
Histograms for all participants. 1-DOF and 2-DOF tasks were compared separately. (A) The distribution of reaching times for all 1-DOF and 2-DOF tasks for the participant with DMD. Since every DOF includes two targets and each target was performed 8 times, we have 16 events per histogram. (B) The average distribution of reaching times for all 1-DOF and 2-DOF tasks for the ten healthy participants. Since every DOF includes four targets and each target was performed 8 times, we have 32 events per histogram. The full vertical lines represent the mean and the dashed the standard deviation.

