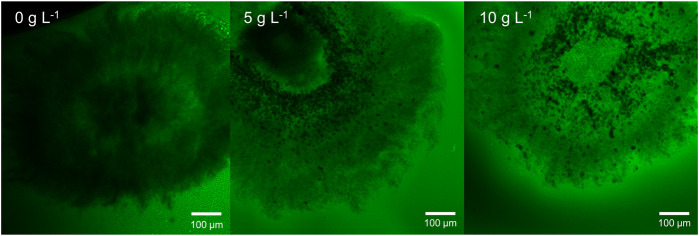
FIGURE 11.
Exemplary microscopic images of sliced pellets from an unsupplemented control culture and MPEC supplemented with glass microparticles (x_50 = 7.9 µm) at concentrations of 5 and 10 g L−1. Staining was performed with dextran fluorescein (10,000 Da). Green areas represent low hyphal density.

