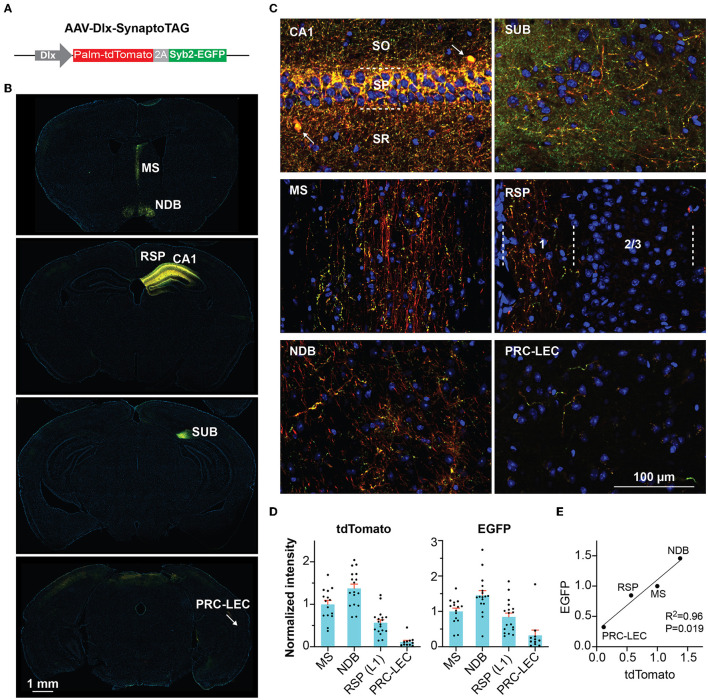
Figure 1.
Tracing GABAergic outputs from the hippocampal CA1 region. (A) Design of AAV-Dlx-SynaptoTAG. (B, C) Low- and high-resolution representative images showing the Palm-tdTomato-positive axons and EGFP-positive boutons in the respective brain regions. The axons and boutons from CA1 GABAergic neurons were detected at the hippocampus, subiculum (SUB), medial septum (MS), and nucleus of the diagonal band (NDB), and the superficial portion of layer 1 of the retrosplenial area (RSP), and the transition area between the perirhinal cortex and the entorhinal cortex (PRC-EC). (D) Quantification of the fluorescence intensities in the different brain regions. The intensities were measured from 11 to 17 sections for each region from four mice. Data are represented as mean ± SEM (E) Correlation between the averaged intensities of EGFP and tdTomato measured in the brain regions.

