Figure 2.
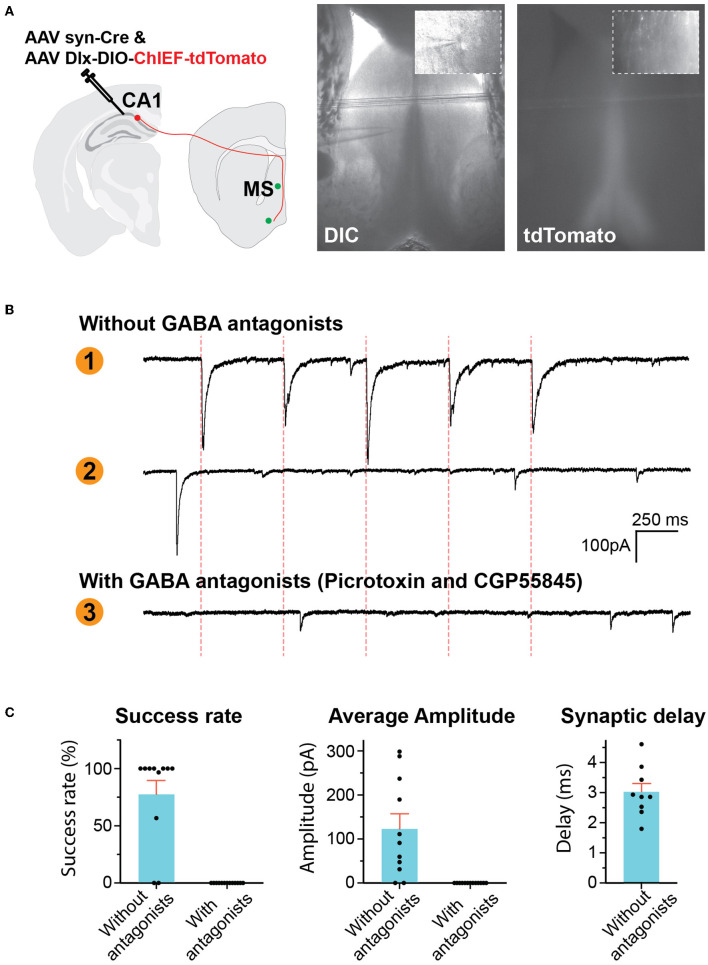
GABAergic hippocampus–septum projections. (A) AAV injection scheme (left). Representative photos of brain slice (right) showing the location of tdTomato-positive axons in the MS and the location of whole-cell patch-clamp recording. The inserts are high-resolution images of the location of the pipette tip. (B) Representative traces of voltage-clamp recording of postsynaptic currents (PSCs). Traces 1 and 2 were recorded in the absence of GABA antagonists, showing a neuron reacting to optical stimulation (Trace 1) and another neuron not responding (Trace 2). Trace 3 was recorded in the presence of picrotoxin and CGP55845. The red dashed lines indicate the time of optical stimuli. (C) Quantification of the PSCs.

