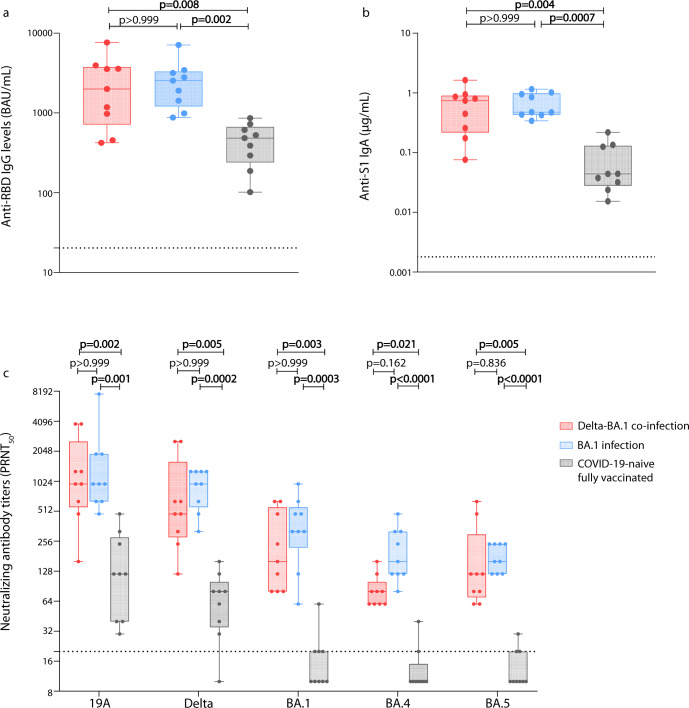
Fig. 1. Humoral immune response 6 months after last immunization in individuals vaccinated and then co-infected with Delta and BA.1, or vaccinated and then infected with BA.1, or in COVID-19-naïve fully-vaccinated individuals.
Blood samples were obtained 6 months after infection for the first two groups or 6 months after the third injection for the third group. Anti-RBD IgG levels were measured using the commercially available bioMérieux Vidas SARS-CoV-2 IgG diagnosis kit according to manufacturer’s recommendations and expressed in binding antibody unit (BAU)/mL. The dotted line represents the threshold of positivity (≥ 20.33 BAU/mL; a). Anti-S1 IgA levels were measured using an ELISA test and expressed in µg/mL. The dotted line represents the positivity threshold (≥0.0018 µg/mL; b). Neutralizing antibody titers against live SARS-CoV-2 isolates using a 50% plaque reduction neutralization test (PRNT50). The isolates used for these experiments were 19A, Delta, Omicron BA.1, BA.4, and BA.5; their GISAID accession numbers are EPI_ISL_1707038, EPI_ISL_1904989, EPI_ISL_7608613, EPI_ISL_12396843, and EPI_ISL_12852091, respectively. The dotted line represents the positivity threshold (titer ≥ 20; c). Data are represented as box and whiskers plot; in each plot, the dots indicate individual samples, the upper and lower limits of the box plot represent the interquartile range [IQR] and the middle line represents the median. Whiskers represent the maximum and minimum value in each plot. All box and whiskers plots represent n = 9 biologically independent samples. A Kruskal–Wallis test followed by Dunn’s multiple comparison tests were performed to assess differences between the three groups.

