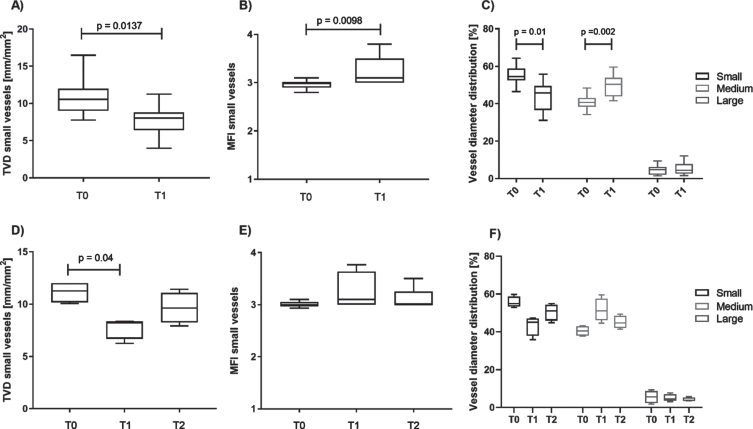
Fig. 2.
Perioperative changes of microcirculatory parameters in sublingual vessels. Panels A-C include data of all children (n = 11), panels D-F include data from a subgroup of children (n = 6) with recordings available at timepoint T2. Small vessel density (A) decreased and the microvascular flow in small vessels (B) increased significantly from T0 to T1. The proportion of small vessels (<10 μm diameter) decreased significantly during surgery, while the proportion of medium vessels (10-25 μm diameter) increased significantly (C). Follow-up recordings 6 h post-surgery (T2) demonstrate a return of small vessel density (D), MFI (E), and diameter distribution (F) towards preoperative values.

