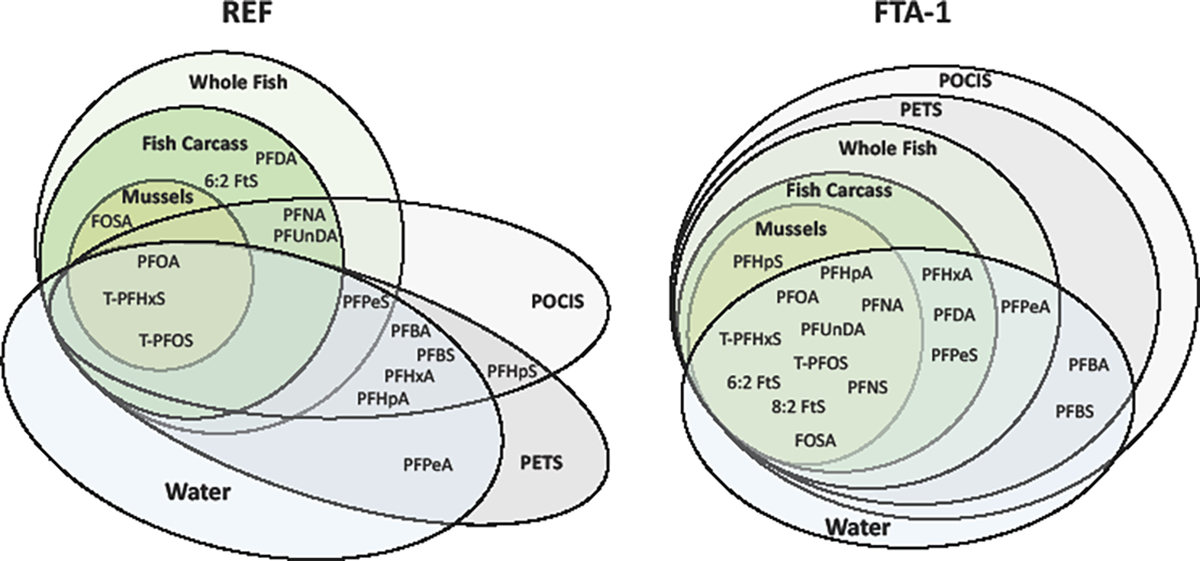
Figure 3.

Diagrams showing overlap in detection of individual per- and polyfluoroalkyl substances (PFAS) in biotic and abiotic media exposed to groundwater from the reference (REF; MA-SDW 491–0063A) and fire-training area contaminated (FTA-1; MA-SDW 488–0083) wells during the 2018 mobile-laboratory experiments conducted on Cape Cod, Massachusetts. [See Table S2 for compound abbreviations; see Tables S4 to S8 for individual PFAS concentration data; individual PFAS detected within water, fish carcass, whole fish, mussels, polar organic chemical integrative sampler (POCIS), or polyethylene tube sampler (PETS) are indicated by different color backgrounds; PFAS occurring in multiple compartments are indicated by overlapping ovals; smaller ovals correspond to fewer detects; larger ovals correspond to more detects; oval shapes drawn for efficient distinction of unique versus overlapping profiles.]
