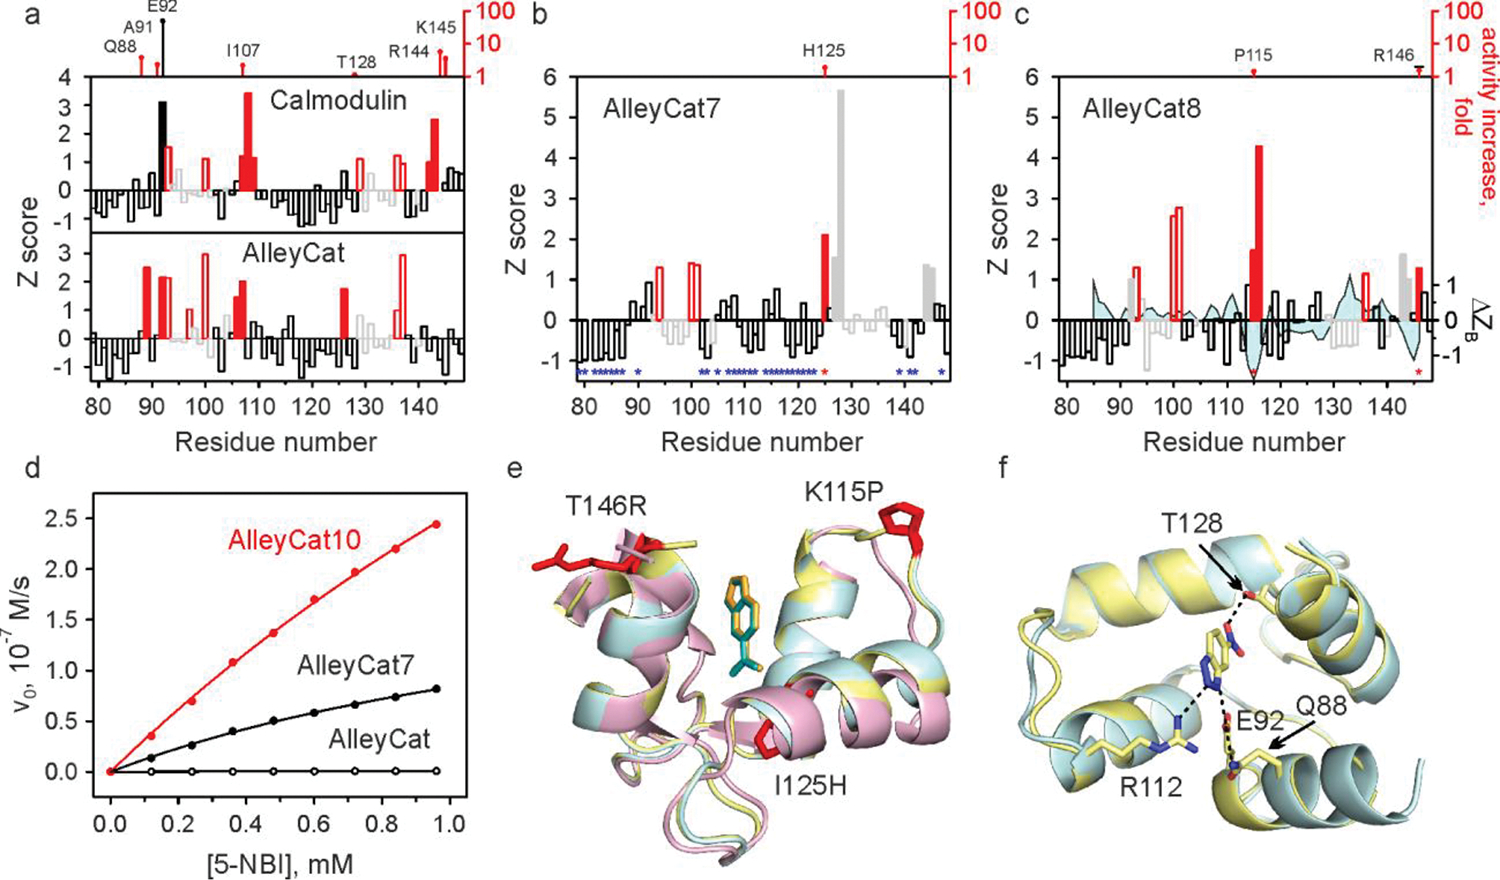
Fig. 3 |. NMR-guided evolution of calmodulin.

a-c, Backbone amide CSP of cCaM/AlleyCat (a), AlleyCat7 (b) and AlleyCat8 (c) upon addition of 2 molar equivalents of 6-NBT. The red bars indicate the protein regions experiencing large chemical shift perturbation (Z≳1). The open red and grey bars identify EF hand residues. The catalytic F92E mutation is shown with a solid black bar. The positions where productive mutations were found are marked by red asterisks in b and c (along with the corresponding increase in kcat/KM relative to the previous round of design, top). Positions where screening identified no productive mutations are marked by blue asterisks in b. The solid grey bars in b and c refer to residues already mutated in previous rounds. The difference in Z-score of crystallographic B-factors (Cα) for the inhibitor bound and free AlleyCat9 is mapped onto the CSP data on AlleyCat8 (ΔZB trace in c). d Michaelis-Menten plots for representative proteins. e Overlay of the crystal structures of C-terminal domain of calmodulin (magenta), AlleyCat9 with the inhibitor (cyan) and AlleyCat10 with the inhibitor (yellow). The residues identified in CSP analysis are shown in red. f Overlay of the crystal structures of apo (cyan) and the inhibitor bound (yellow) in AlleyCat10.
