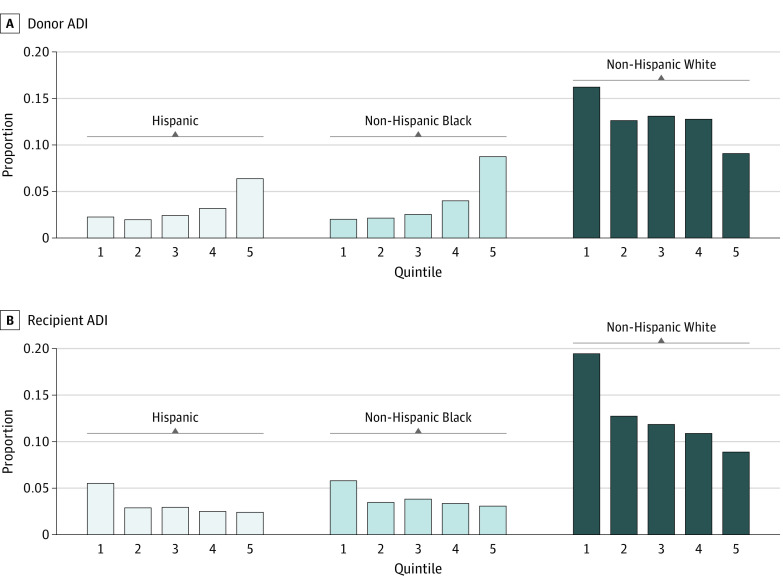
Figure 1. Grouped Bar Plots of Donor and Recipient Area Deprivation Index (ADI) Quintile by Race.
Proportion of donors within ADI quintile by race. Hispanic, non-Hispanic Black, and non-Hispanic White races and ethnicities are displayed given small sample sizes for American Indian or Alaska Native, Asian or Pacific Islander, and multiracial groups. ADI quintile 1 indicates the most resourced and 5, the least resourced.

