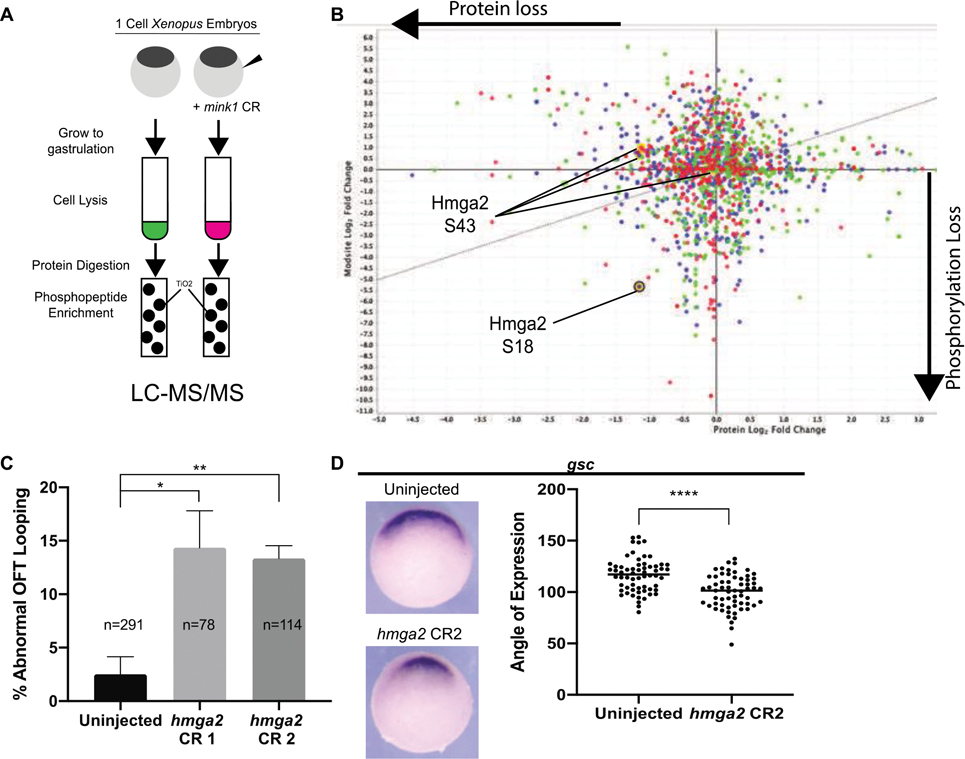
Figure 4: Global Phosphoproteomic Analysis Reveals HMGA2 As a Potential Downstream MINK1 Effector.
A) Schematic of experimental pathway for phosphoenriched mass spectrometry experiment. B) Hmga2 exhibited loss of protein and phosphorylation at S18 residue due to depletion of mink1. Graphic representation of global phospoproteome due to mink1 depletion, X-axis represents protein log2 fold change, Y-axis represents phosphorylation log2 fold change. Red represents stage 10, green represents stage 11, blue represents stage 12. Yellow circles represent Hmga2 protein level changes. C) Quantification of abnormal outflow tract looping in hmga2 crispants. 3 biological replicates. D) Hmga2 is required for Spemann Organizer gene expression. Representative images and quantification of reduced goosecoid expression in hmga2 crispants. 3 biological replicates. P < 0.0001= ****, p < 0.005= **, p < 0.05= * by two-tailed T-test.

