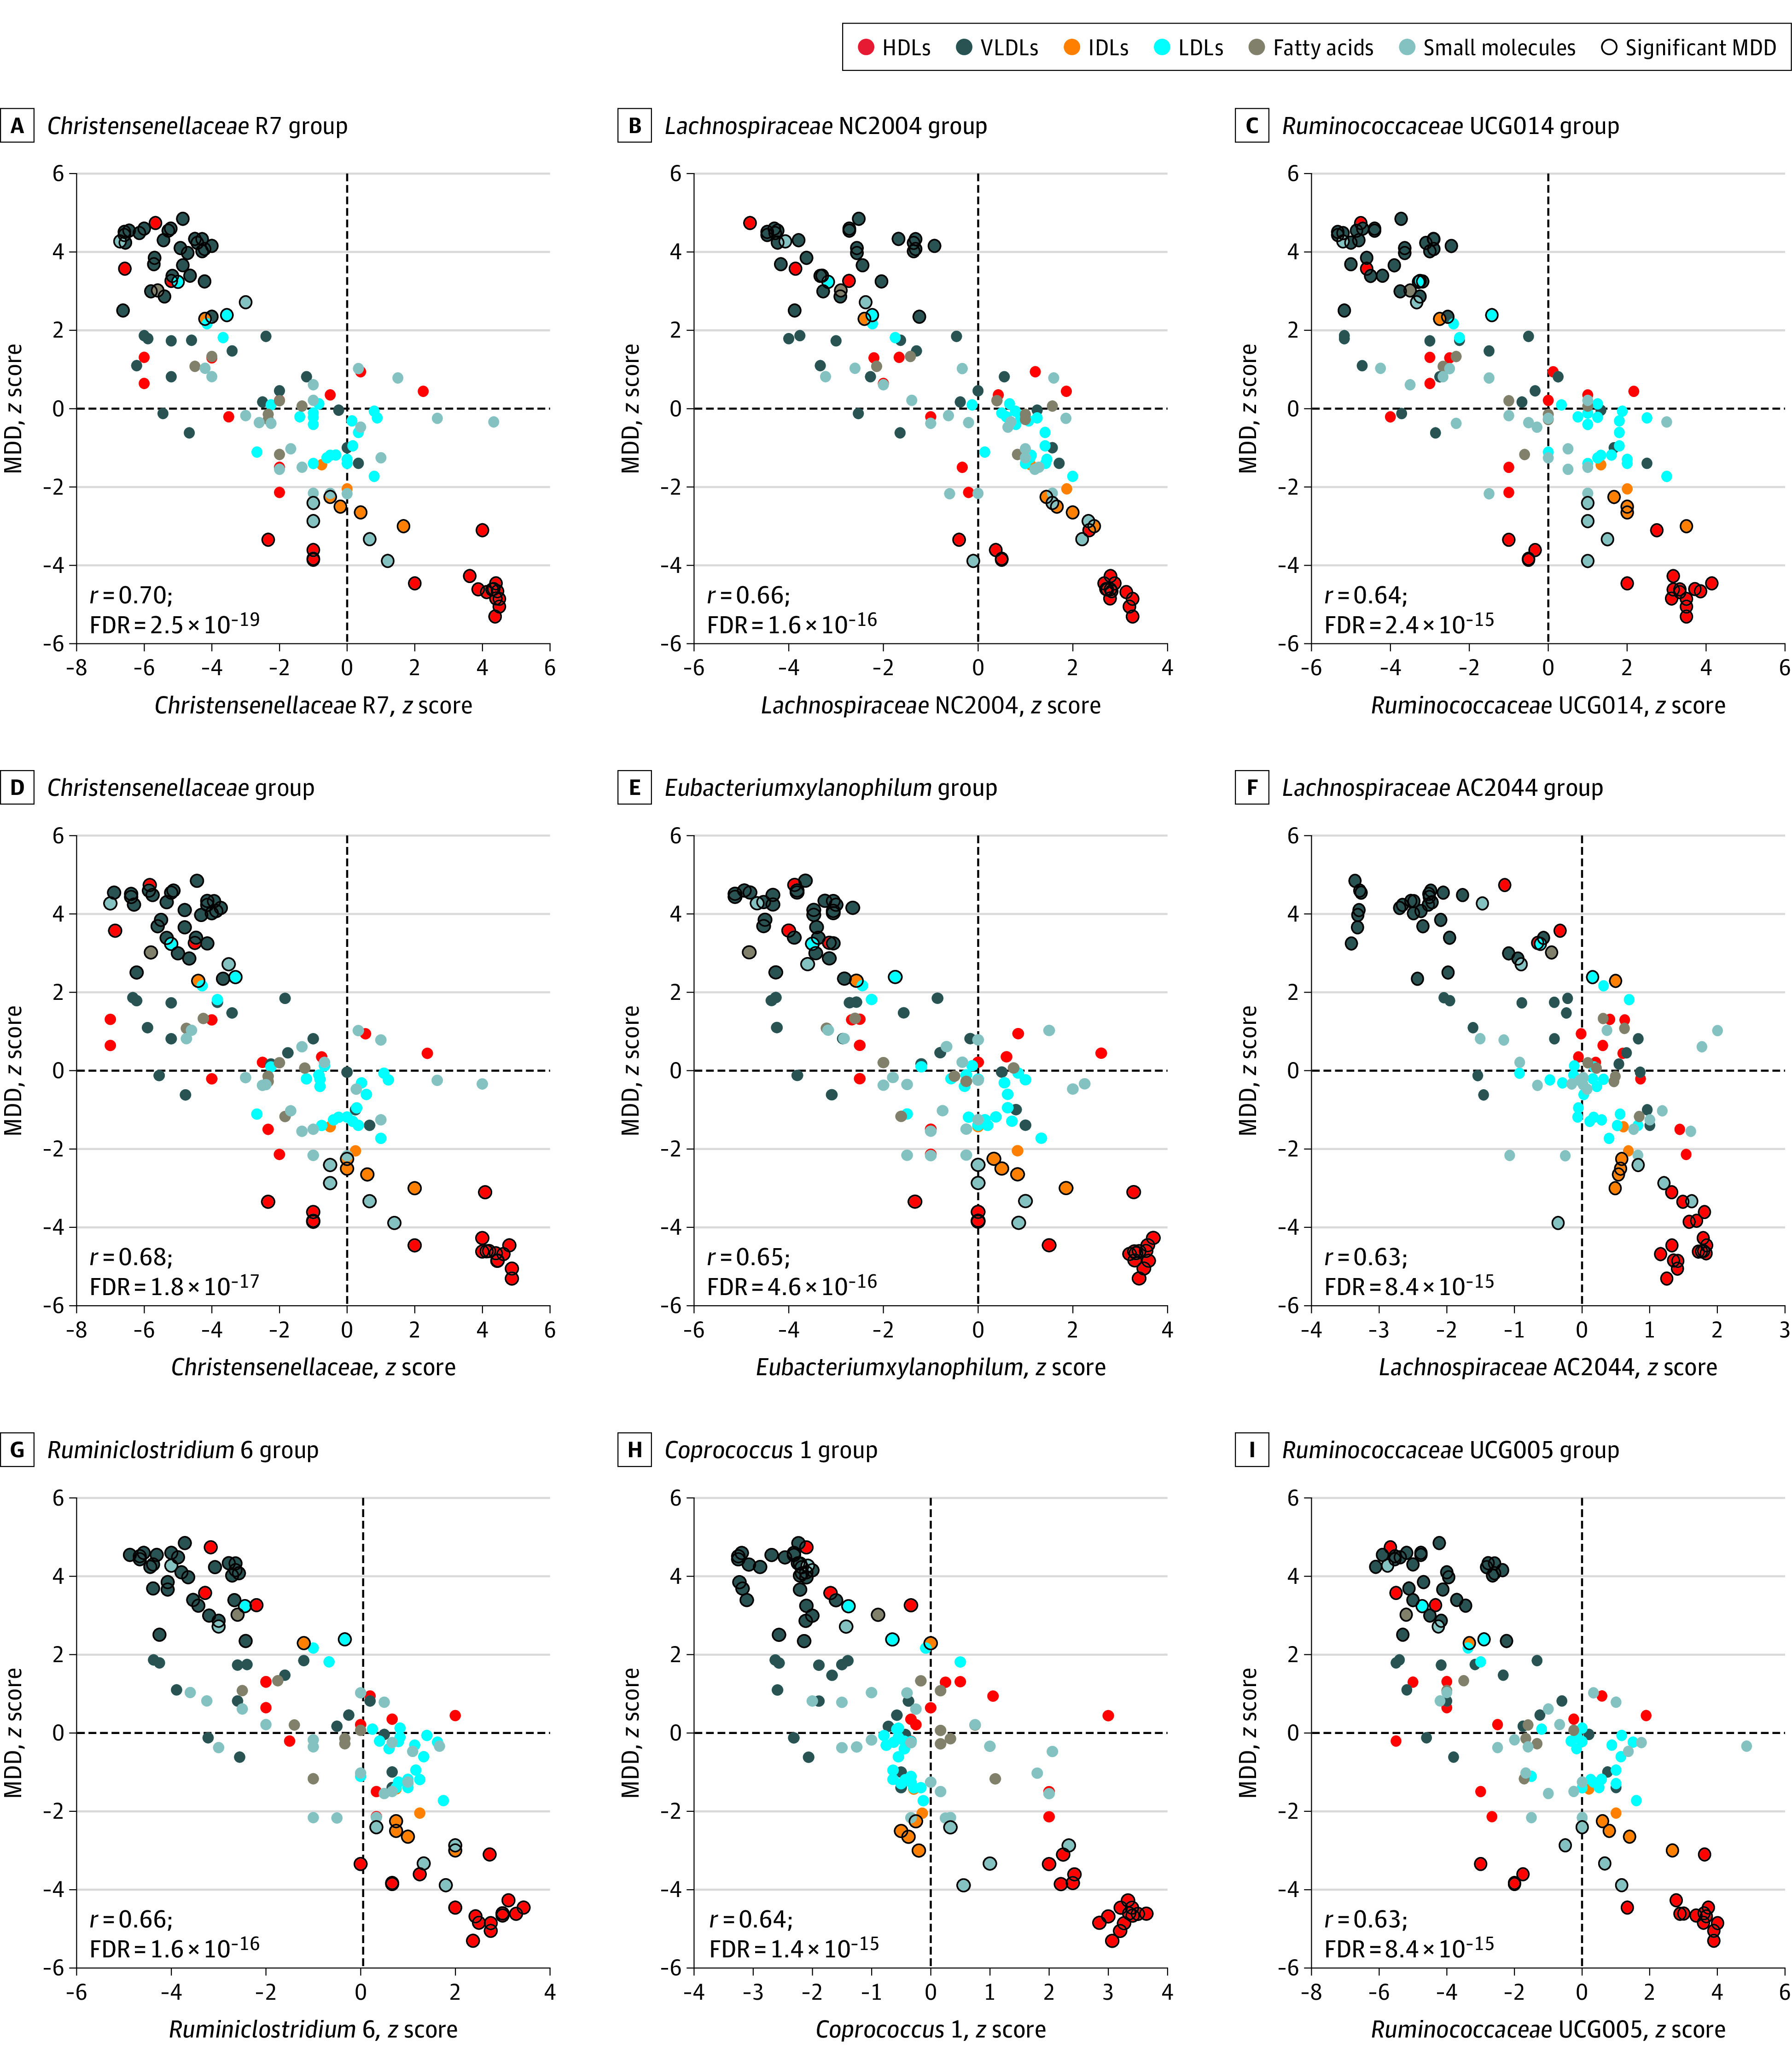
Figure 2. Association of Metabolic Profiles (z Scores) of Healthy Gut Microbiota and Major Depressive Disorder (MDD).

Scatterplots showing correlations between the metabolic signatures of microbial taxa and MDD. Taxa that show inverse correlation with the metabolic signatures of MDD are shown. Each dot represents a metabolite. The x-axis shows the association of the metabolite with microbial taxa, and the y-axis shows the association of the metabolite with MDD. Different colors of the dots represent the class of the metabolite, and the metabolites highlighted with black circles are significantly associated with MDD in model 4.
