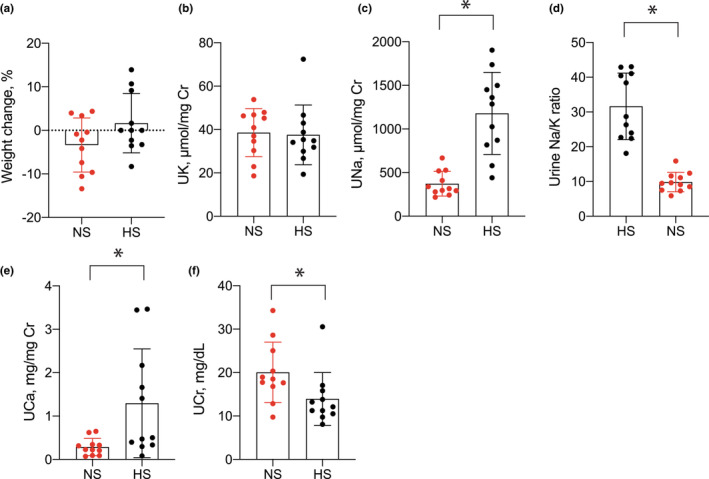
FIGURE 1.

Urine electrolytes in mice consuming NS and HS diets. (a) Weight change (%) over the 3‐week study period for animals consuming NS and HS diets. (b) Urine K+, (c) urine Na+, (d) urine Na+‐to‐K+ ratio, (e) urine Ca2+, and (f) urine creatinine during the third week of treatment in animals consuming NS or HS diets. N = 11 per group. *p < 0.05 by unpaired t‐test. HS, high salt; NS, normal salt.
