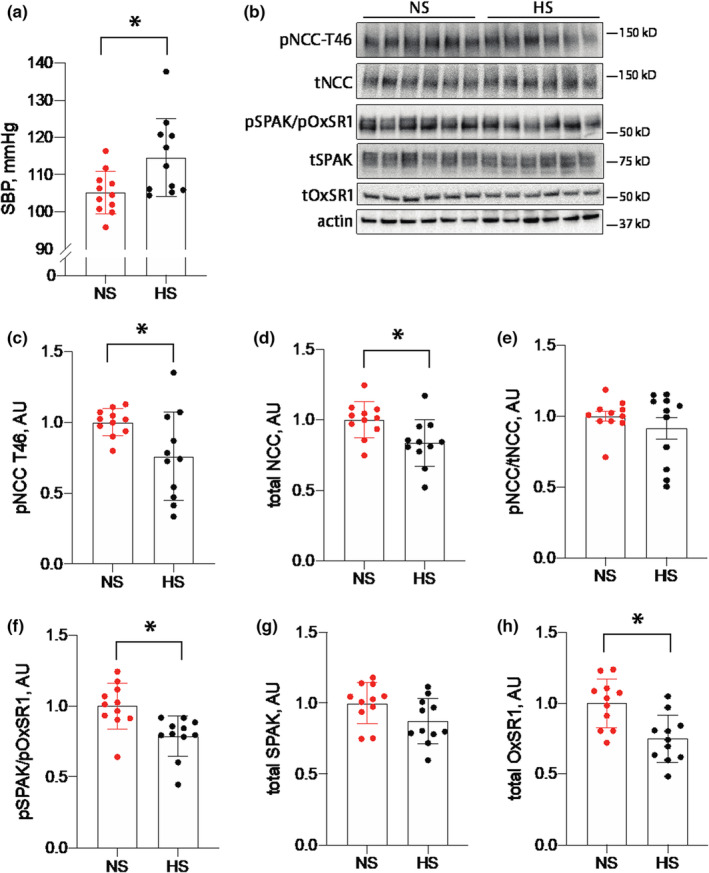
FIGURE 3.

Blood pressure and SPAK/OxSR1/NCC abundances in mice‐consuming NS and HS diets. (a) Systolic blood pressures during the third week of treatment from animals consuming NS or HS diets. (b) Representative Western blot images of pNCC, tNCC, pSPAK/pOxSR1, tSPAK, and tOxSR1 from animals consuming NS or HS diets. (c–h) Actin‐normalized quantification for each protein individually and the pNCC‐to‐total NCC ratio. N = 11 per group. *p < 0.05 by unpaired t‐test. HS, high salt; NCC, NaCl cotransporter; NS, normal salt; pNCC, phosphorylated NCC.
