
FIGURE 4.
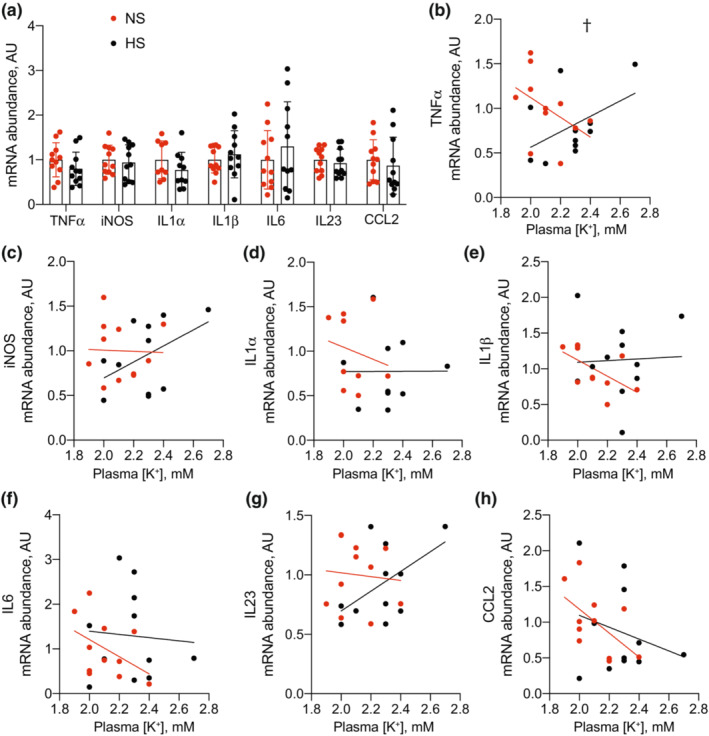
Total kidney transcript abundance of proinflammatory transcripts in mice consuming NS and HS diets. (a) Total kidney proinflammatory transcript abundance from NS and HS‐fed animals. (b–h) Linear regression analyses demonstrating the relationship between each transcript and blood K+. N = 11 per group. † p < 0.05 for the difference in slopes between lines for each group. HS, high salt; NS, normal salt.