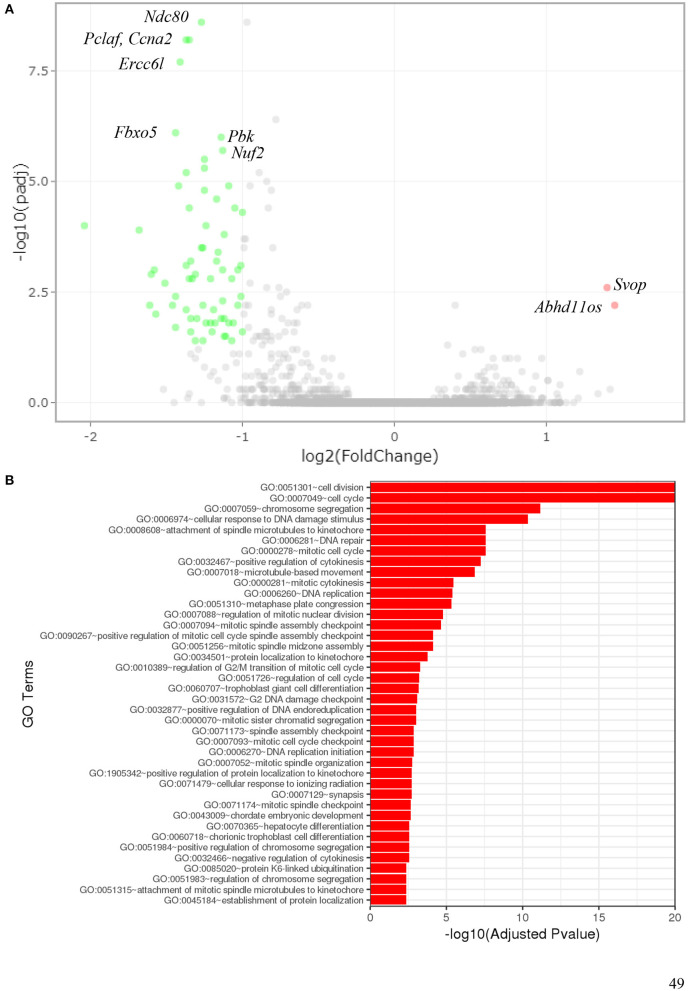
Figure 11.
Gene expression of astrocytes 24 h after exposure to 2 Gy X-rays. Gene expression of primary murine astrocytes was analyzed using RNA sequencing (n = 4). (A) In this volcano plot, the log10 of the adjusted P-value [log10 (padj)] is plotted against the log2 Fold Change in expression of each gene. The two upregulated genes (pink dots) are annotated as well as some of the most significantly downregulated genes (green dots). (B) Gene ontology (GO) terms that were significantly enriched with an adjusted P-value < 0.05 in the differentially expressed gene sets are listed (up to 40 terms). The full list of enriched GO terms is available in Supplementary material.

