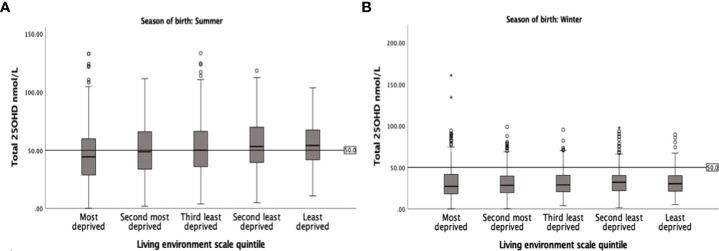
Figure 3.
Box plot of 25OHD levels in the summer-born (A) and the winter-born (B) cohort of the different living environment quintiles. Note the variation in 25OHD levels by the different living environment quintiles in the summer-born and the persistently low 25OHD levels in the winter-born cohort.

