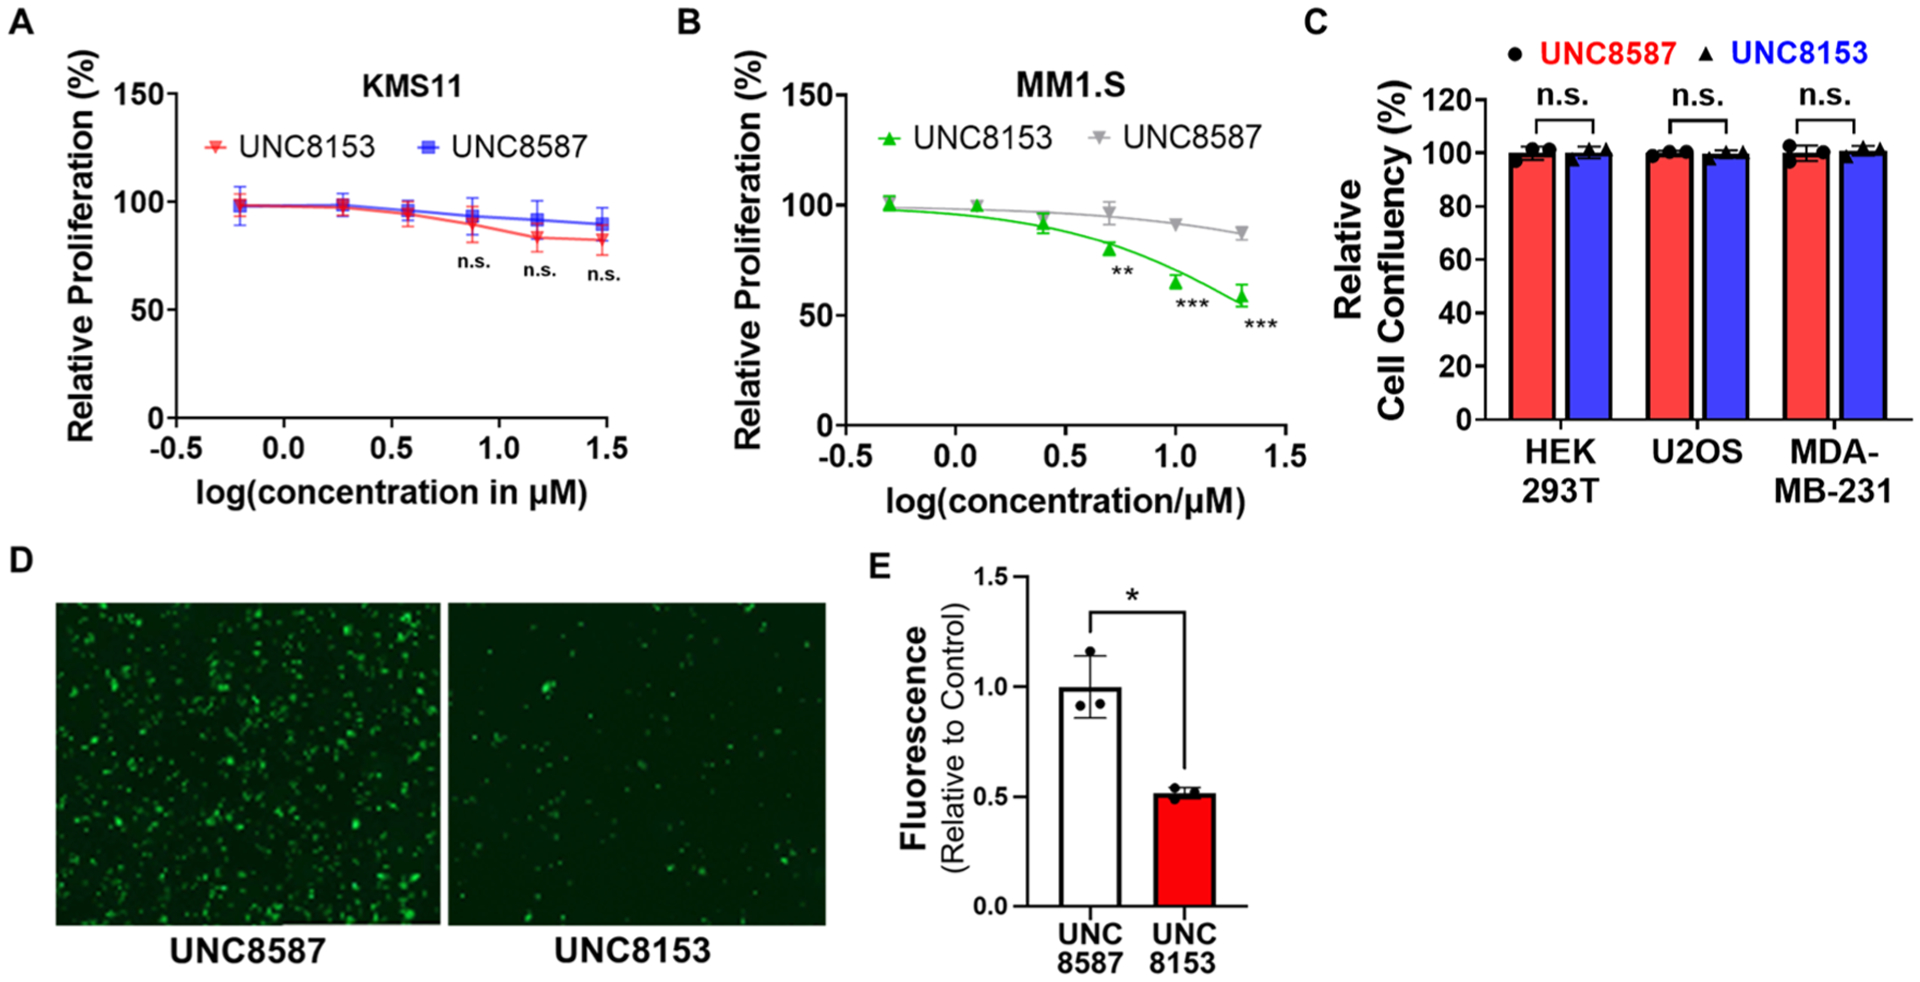
Figure 6.

Degradation of NSD2 results in antitumor phenotypes. (A) KMS11 cells were treated for 8 days with UNC8153 or UNC8587 (control) at varying concentrations and quantified for cell viability by CellTiter-Glo. Data are reported as the mean of four independent experiments ± SD. Not significant: n.s. (B) MM1S cells were treated for 8 days with UNC8153 or UNC8587 (control) at varying concentrations and counted for cell viability after trypan blue staining. Data are reported as the mean of three replicates ± SD. **p < 0.01, ***p < 0.001 (one-tailed t-test). (C) Relative cell confluency of cells treated with 20 μM UNC8153 or UNC8587 (control) for 5 days. Data are represented as the endpoint mean confluency relative to control from three independent experiments ± SD. Not significant: n.s. (D) Representative microscopic images from adhesion assays with green fluorescent KMS11 cells treated with 25 μM UNC8153 or UNC8587 for 14 days. Cells were plated in Matrigel-coated plates for 12 h, and after washing the plates with PBS, the images were acquired at 10× magnification. (E) Fluorescence intensity of adherent cells treated with 25 μM UNC8153 or UNC8587. Data are represented as mean fluorescence intensities from three independent experiments relative to control ± SD. *p < 0.05 (one-tailed t-test).
