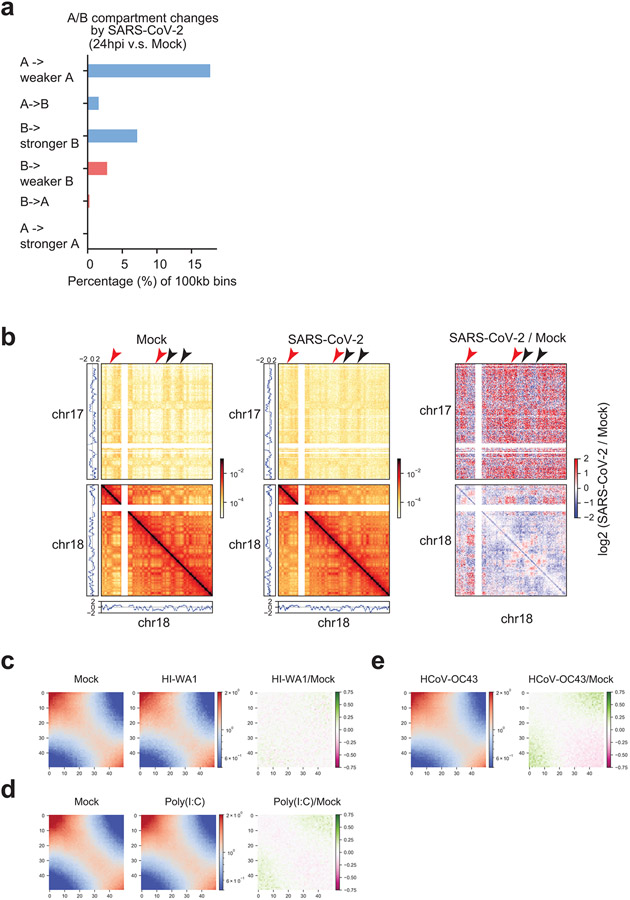
Extended Data Figure 4. Additional data of A/B compartmental changes.
a. A barplot showing the percentage of genomic bins (100kb bin size) that can be categorized into six groups based on their compartmental score changes after SARS-CoV-2 infection (E1 value change > 0.2, see Methods). These six categories are: A to weaker A, A to B, B to stronger B, B to weaker B, B to A, and A to stronger A.
b. Snapshots of inter-chromosomal Hi-C contact matrices between chr17 and chr18 (upper), and intra-chromosomal Hi-C contact matrices within chr18 (lower) in Mock and SARS-CoV-2 infected samples. On the right, differential contacts are shown as log2 fold changes of SARS-CoV-2/Mock. PCA E1 scores were put at sides to show the A or B compartments. Red and black arrowheads respectively point to increased A-B and reduced A-A interactions after SARS-CoV-2 infection. Bin size = 320kb. Color scales indicate Hi-C contact frequencies (left and middle), and log2 fold change of SARS-CoV-2/Mock contact frequencies (right).
c,d,e. Saddle plots from Hi-C 3.0 after treatments by HI-WA1 (c), poly(I:C) (d), and HCoV-OC43 infection (e), respectively, showing negligible impacts on compartmental interactions. HCoV-OC43 and HI-WA1 shared the same Mock sample. In each figure, color scales indicate observed/expected (O/E) Hi-C contact frequencies (left and middle), and log2 fold change of O/E contact frequencies (right).

