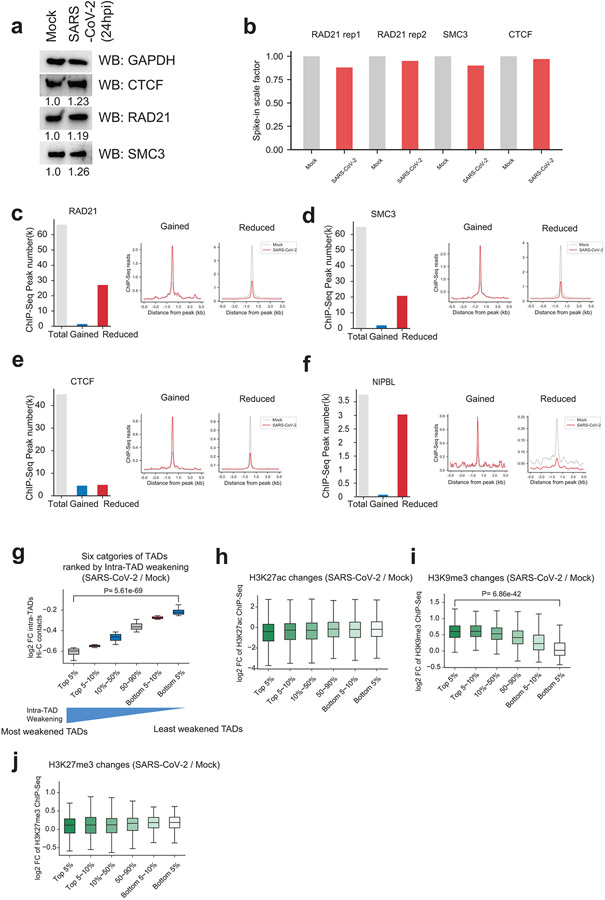
Extended Data Figure 7. Cohesin was specifically depleted from intra-TAD regions and epigenetic features of different groups of TADs.
a. Western blots showing the protein abundances of cohesin (RAD21, SMC3) and CTCF in Mock and SARS-CoV-2 infected cells. GAPDH was used as a loading control. Relative expression of each protein to the Mock control group was labeled under each image.
b. Barplots showing the scale factors calculated based on human/mouse reads ratio in both Mock and SARS-CoV-2 conditions that permit calibrated ChIP-Seqs of CTCF, RAD21 and SMC3. These factors were not globally affected by virus infection (the ratios are comparable in mock and infected conditions).
c. Left barplot shows the numbers of total, the gained or reduced RAD21 ChIP-Seq peaks after SARS-CoV-2 infection at 24hpi; the profile plots in the middle and right show the signals of RAD21 ChIP-Seq at the gained or reduced ChIP-Seq peaks in Mock and SARS-CoV-2 conditions.
d,e,f. Similar to panel c, these plots show analysis of ChIP-seqs of SMC3, CTCF and NIPBL in Mock and SARS-CoV-2 conditions.
g. A boxplot showing the log2 fold changes (FC) of intra-TAD Hi-C contacts for six categories of TADs. All TADs are ranked based on the quantitative changes of intra-TAD interactions and the six categories include the Top 5%, top 5~10%, 10~50%, 50~90%, bottom 5~10%, and the bottom 5%, respectively. “Top 5%” represents TADs with the most severely-weakened intra-TAD interactions after SARS-CoV-2 infection. From left to right, n = 205, 205, 1637, 1637, 205, 205 TADs. P = 5.61e-69, calculated with a two-sided Mann-Whitney U test.
h,i,j. Boxplots showing the log2 fold changes (FC) of ChIP-Seq signals of H3K27ac (from left to right, n = 1808, 1841, 18640, 22245, 3074, 3205 peaks), H3K9me3 (from left to right, n = 205, 205, 1637, 1637, 205, 205 regions), and H3K27me3 (from left to right, n = 205, 205, 1637, 1637, 205, 205 regions) in the six categories of TADs as shown in panel g. P = 6.86e-42 in H3K9me3 panel, calculated with a two-sided Mann-Whitney U test.
For all boxplots, the centre lines represent medians; box limits indicate the 25th and 75th percentiles; and whiskers extend 1.5 times the interquartile range (IQR) from the 25th and 75th percentiles.

