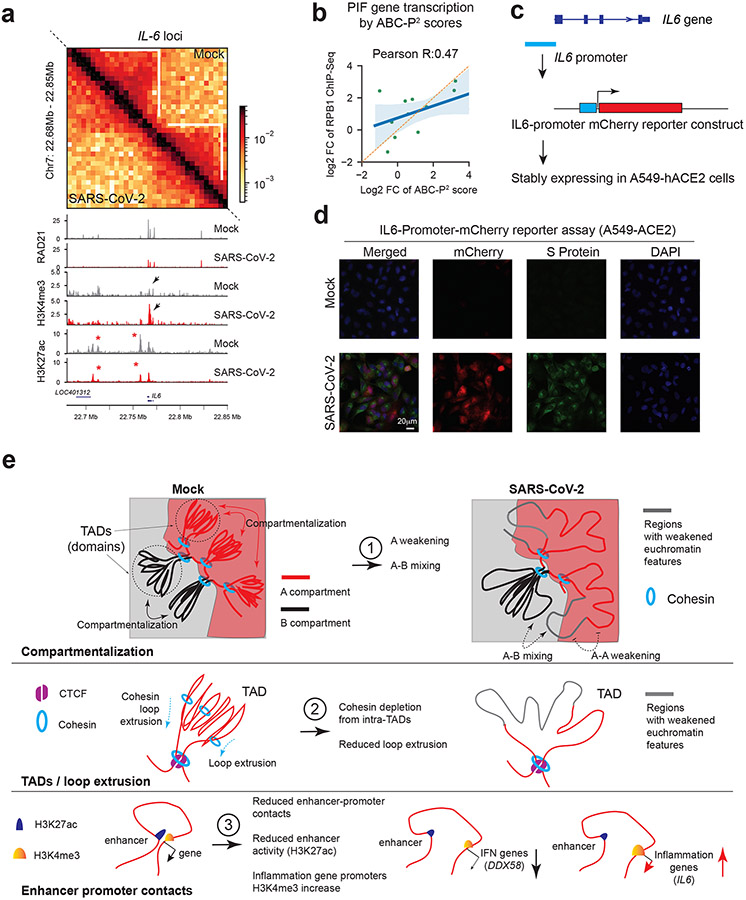
Fig. 6. Augmented promoter H3K4me3 and pro-inflammatory gene activation.
a. Hi-C matrices (bin size: 5kb) and ChIP-Seq tracks at the IL6 locus in Mock and SARS-CoV-2 conditions. White lines mark TADs, with intra-TAD interactions weakened throughout. Red asterisks show reduced H3K27ac peaks. Black arrows show enhanced H3K4me3 on IL6 promoter. Color scales indicate Hi-C contact frequencies.
b. A scatter plot showing the correlation between the ABC-P2 scores and true transcriptional changes of PIF genes (RPB1 ChIP-Seq). Fold changes denote SARS-CoV-2/Mock. Error bands indicate the 95% confidence interval of the regression estimate. Pearson’s correlation coefficient is shown.
c. A diagram of an IL6-promoter driven mCherry reporter.
d. Representative images of mCherry (red) and SARS-CoV-2 Spike protein (green) in cells carrying IL6-Promoter-mCherry reporter under Mock or SARS-CoV-2 infection (0.1 MOI, 24hpi). DAPI (blue). Scale bar is shown.
e. A model that summarizes current observations of chromatin restructuring by SARS-CoV-2 infection at the 3D genome and epigenome scale. They are categorized from top to bottom in terms of A/B compartments, TADs/loop extrusion and enhancer-promoter contacts (see Extended Data Fig.1a,b for additional information). These chromatin changes correlate with and may explain transcriptional deregulation of immuno-pathological gene deregulation in COVID-19 patients.

