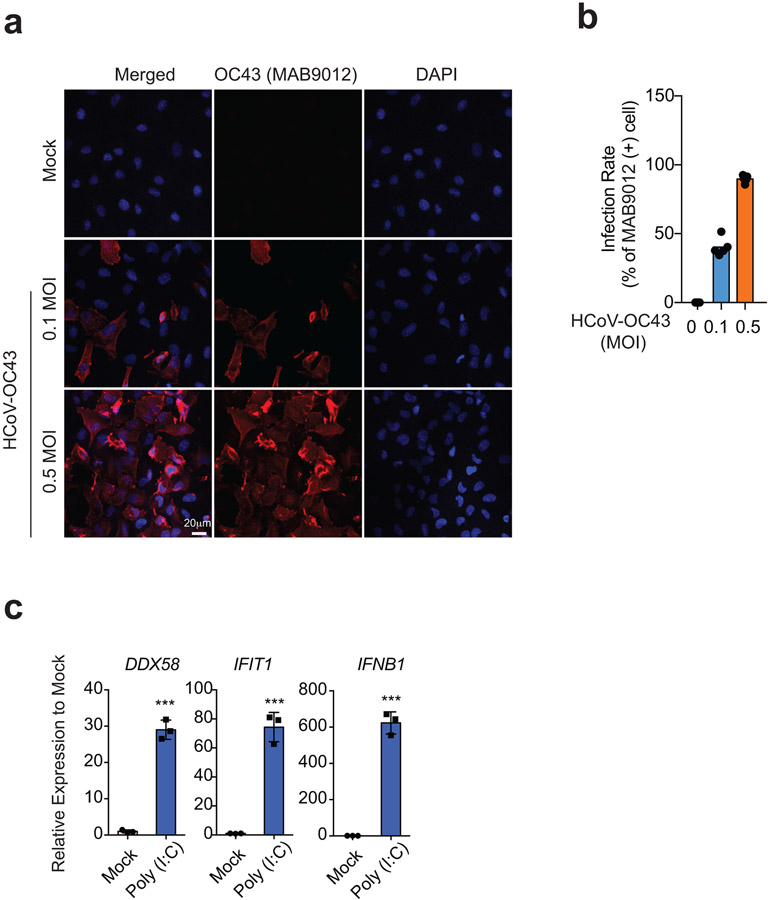
Extended Data Figure 3. Quality check of HCoV-OC43 infection and Poly (I:C) treatment in A549-ACE2 cells.
a. To examine how many cells were infected by HCoV-OC43 at 24hpi, immunostaining using a monoclonal antibody targeting HCoV-OC43 was conducted (MAB9012). Here we show representative confocal images of Mock and HCoV-OC43 infected A549-ACE2 cells stained with MAB9012 (red) and DAPI (blue). Scale bar is shown.
b. Barplots showing quantification of infection rates of HCoV-OC43 at 0.1 and 0.5 MOIs (24hpi). Data shows n = 5 for each quantification.
c. Barplots of DDX58, IFTI1, IFNB1 gene expression (RT-qPCR) showing known antiviral responses in poly(I:C) transfected cells. n = 3, representative of two independent experiments, P = 5.59e-5 (DDX58), 2.31e-4 (IFIT1), 5.94e-5 (IFNB1), calculated with a two-sided independent t-test. Data show Mean +/− SD from replicates (***, p<0.001).

