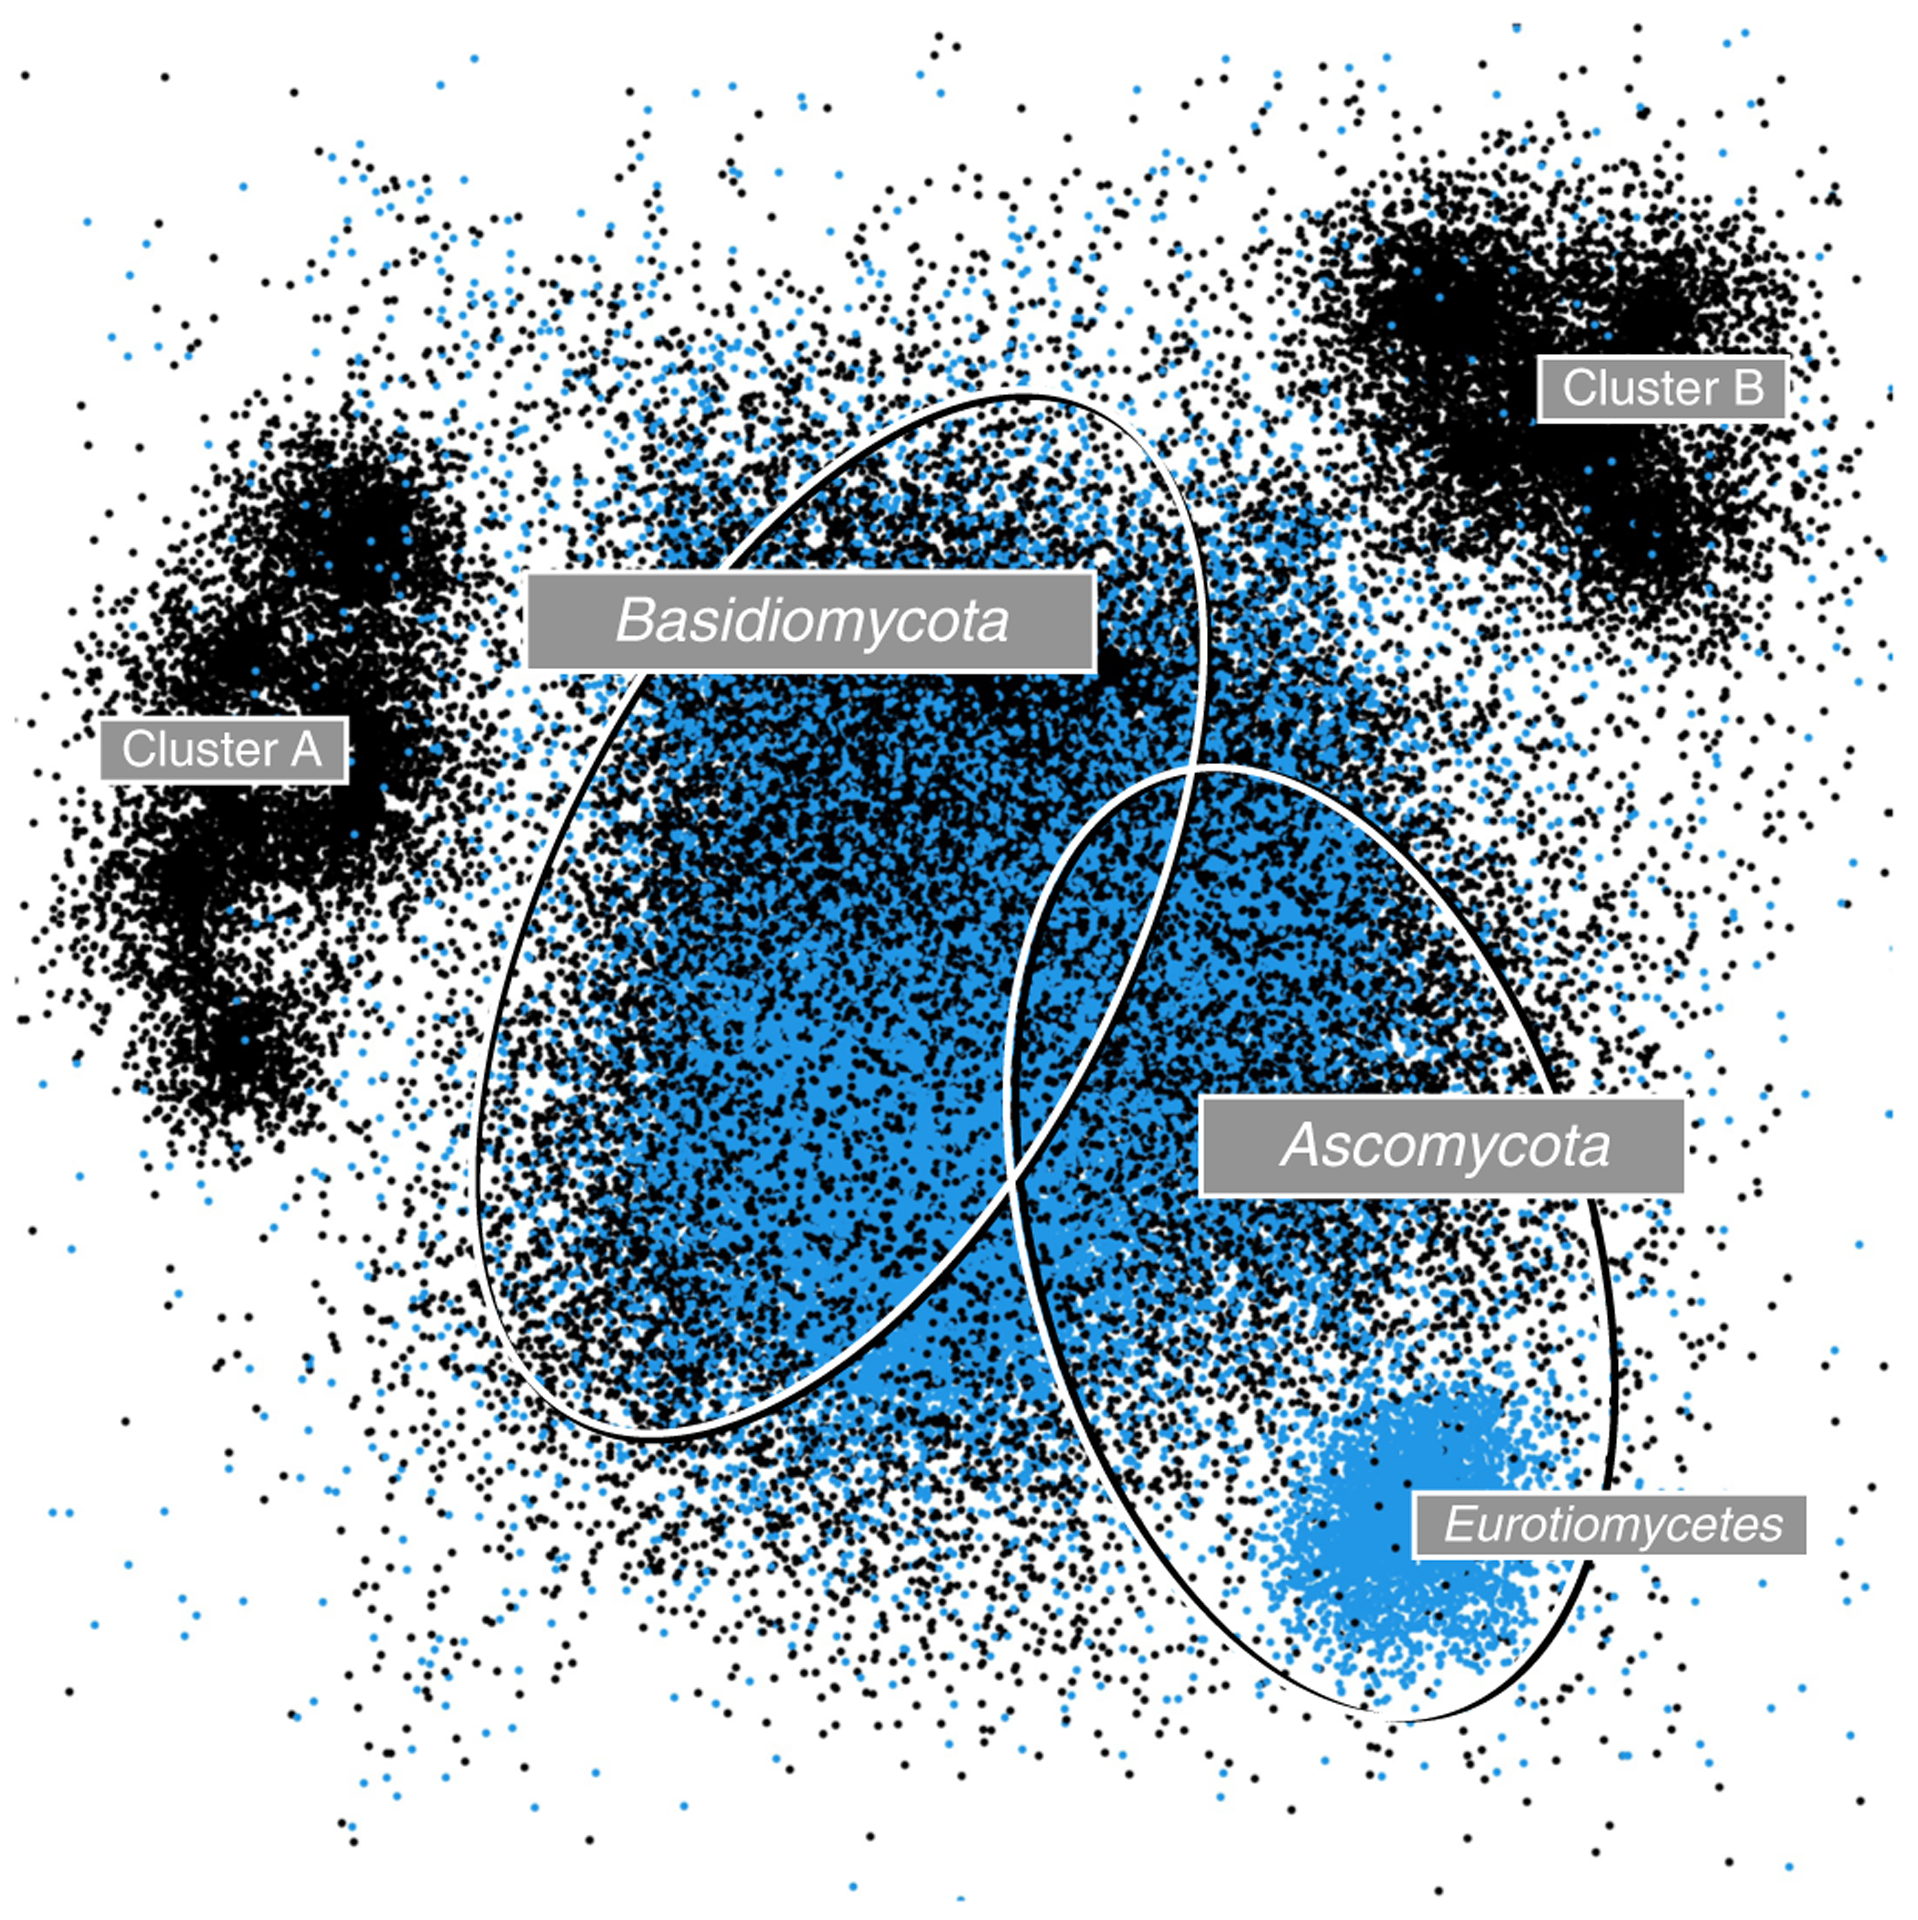
Fig. 3 |. Visualization of new lineages.

Environmental samples of ITS amplicons generated from the fungal microbiome of switchgrass (Panicum virgatum) at a site in North Carolina, USA (SRA accession number SRS7144269; see ref.50 for the corresponding paper). The approximately 60,000 original fungal ITS reads from the switchgrass sample (black dots) were analysed together with 84,000 ITS sequences (blue dots) from the UNITE General FASTA Release 8.2. (https://unite.ut.ee/repository.php). Visualization was done in the rgl package in R (https://r-forge.r-project.org/projects/rgl) after employing a sparse similarity matrix approach, with multidimensional ordination using LargeVis51 based on fast multilevel clustering (fMLC; thresholds of 0.95 and 0.98)52. The two ellipses indicate the approximate location of Ascomycota (separate smaller cluster represents Eurotiomycetes) and Basidiomycota sequences; the large centre cluster also contains representatives of the other phyla present in Fungi. The reads from the Panicum sample form two additional clusters (A and B) in the periphery of the UNITE reference sequences, which indicate phyla or classes only sparsely captured in the UNITE General FASTA Release.
