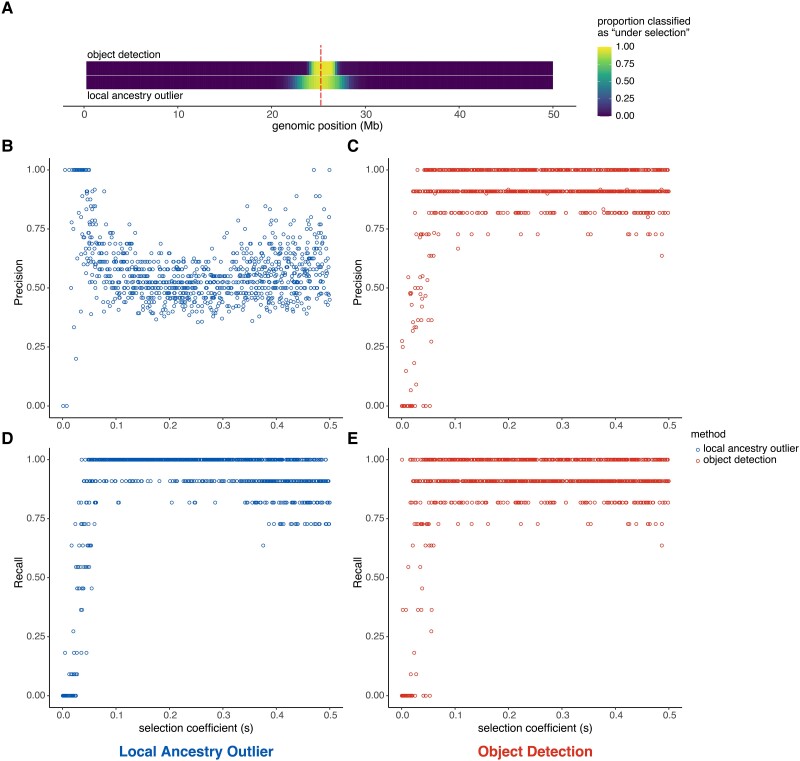
Fig. 3.
Comparison of local ancestry outlier approach and object detection method. (A) Heatmap showing, for each genomic window, the proportion of simulations that had that region classified as “under selection” by either the object detection (top) or local ancestry outlier (bottom) methods. The position of the true selected variant is indicated by the vertical dashed red line. Precision across a range of selection coefficients (s) for (B) the local ancestry outlier approach and (C) the object detection method. Recall across a range of selection coefficients (s) for (D) the local ancestry outlier approach and (E) object detection method. (Also see supplementary figs. S2 and S3, Supplementary Material online.)

