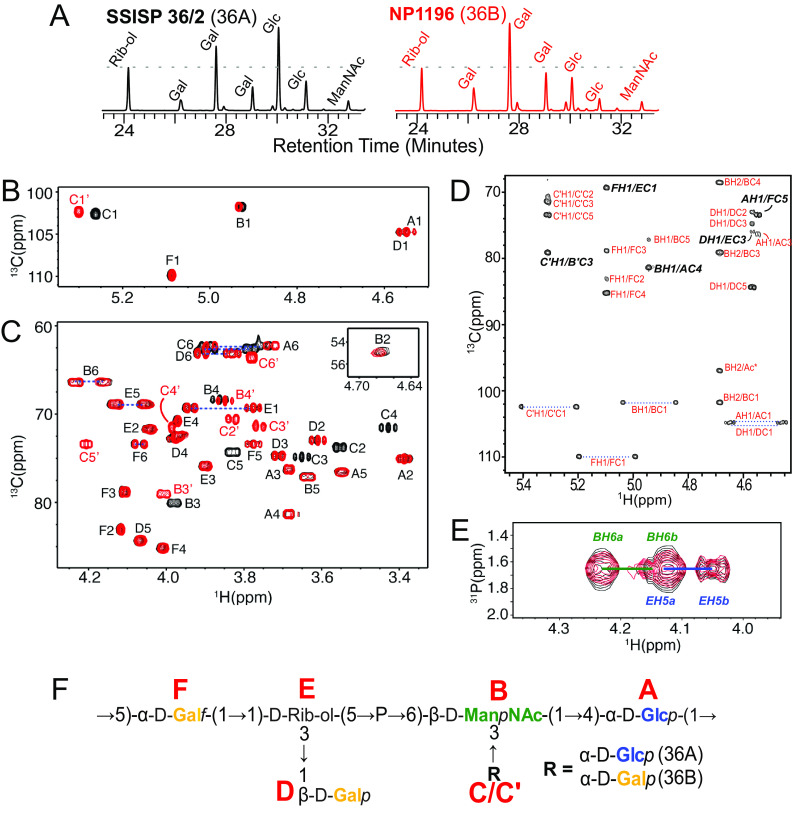
FIG 2.
Biochemical analysis of 36A and 36B capsule polysaccharide. (A) GC/MS analysis chromatograph revealing carbohydrate composition of HF-treated capsule PS purified from SSISP36/2 (36A) and NP1196 (36B). Dotted lines are drawn at the intensity value of ribitol (Rib-ol) for comparison. Relative quantities of each carbohydrate calculated according to the integration of curves corresponding are provided in Table S1. (B and C) Overlay of 1H-13C HMQC NMR spectra of regions containing chemical shifts corresponding to anomeric (B) and ring (C) positions in 36A (black) and 36B (red) capsule PS. Peak assignments are provided in Table 2. (D) 1H-13C HMBC NMR spectrum for 36B capsule PS. (E) Overlay of 1H-31P HMBC NMR spectra for 36A (black) and 36B (red) capsule PS. Cross peaks corresponding to interresidue glycosidic bonds (italicized and bolded) are shown in panels D and E. (F) Structure of 36A and 36B capsule PS. Red letters denote the residue name assigned to each carbohydrate in the NMR spectra.

