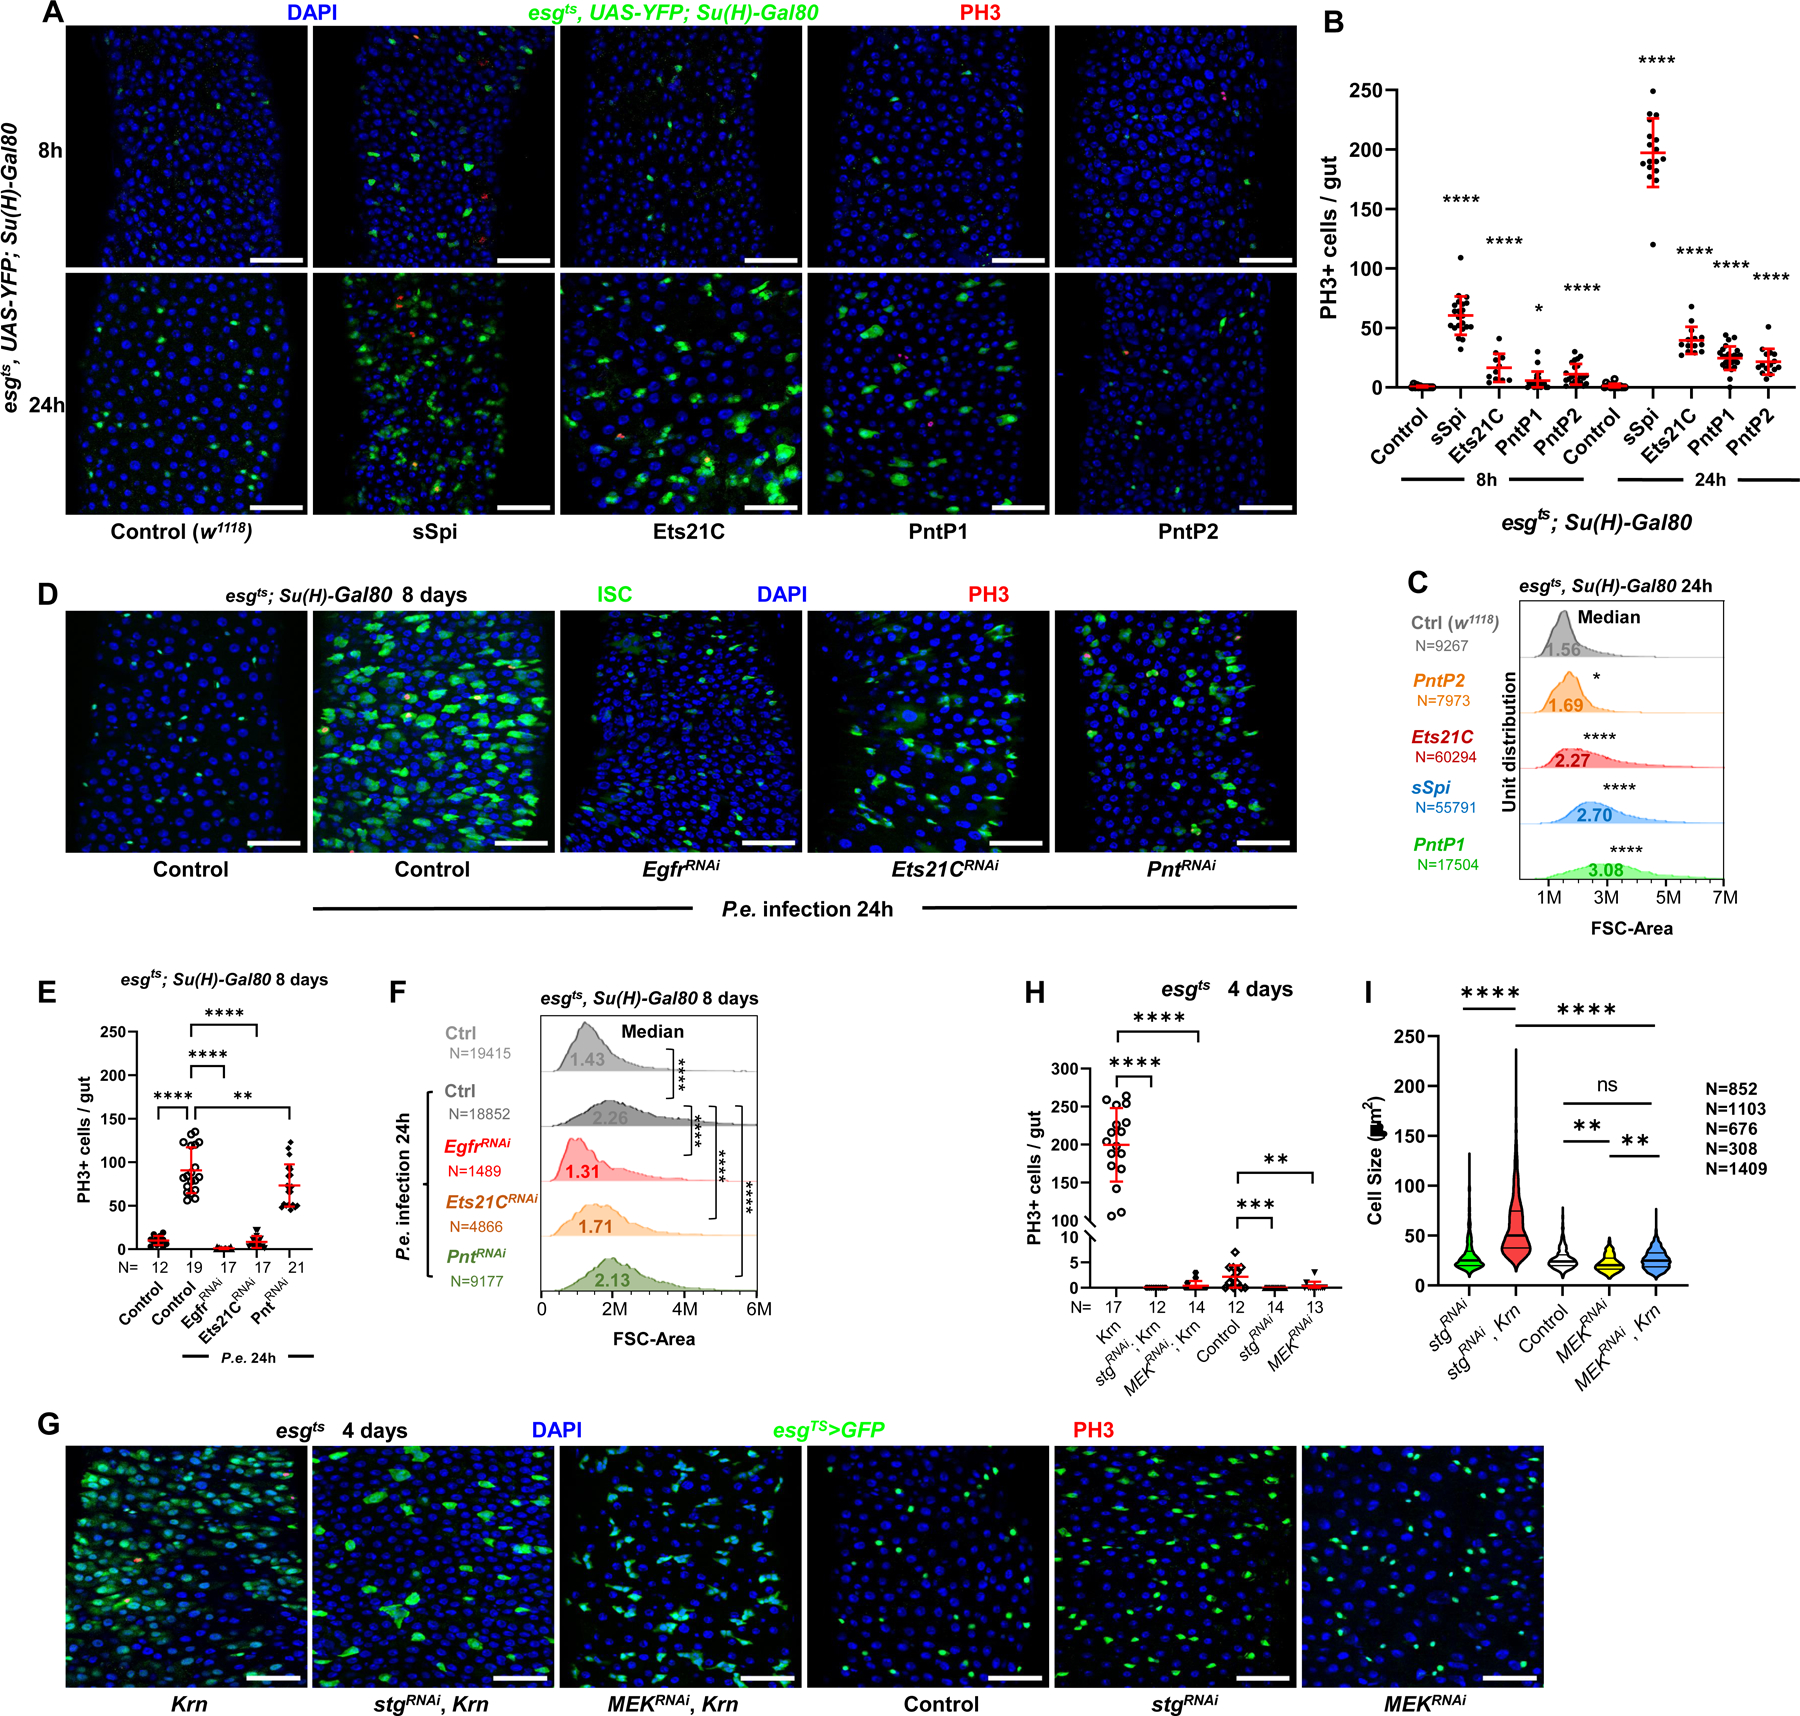
Figure 1. EGFR signaling regulates ISC growth and division.

(A) Confocal images of posterior midguts, showing the induction of ISC proliferation and growth by EGFR signaling. Guts were stained with Phosphorylated Histone H3 (PH3) and DAPI. Top panels: 8h transgene induction in ISCs, showing a very low level of YFP fluorescent protein accumulation. Bottom panels: 24h induction. From left to right: control (w1118), sSpi OE, Ets21C-PC OE, PntP1 OE, and PntP2 OE. Scale bar is 50μM. (B) Quantification of PH3+ mitotic cells in whole guts. Both 8h and 24h activation of EGFR signaling led to significantly increased mitotic cell numbers, with 24h activation having a more robust proliferative effect. (C) Flow cytometry unit distribution of Forward Scatter (FSC) Area of YFP+ ISCs upon 24h activation of EGFR signaling by EGF ligand sSpi or downstream transcription factors Pnt and Ets21C. ISC cell size was increased by EGFR activation. (D-F) The requirements of EGFR signaling and downstream transcription factors Pnt and Ets21C for ISC proliferation and growth during tissue repair. (D) Confocal images of posterior midguts infected with Pseudomonas entomophila (P.e.). Guts were stained for PH3 and with DAPI. (E) The increase of mitotic cell numbers upon P.e. infection is dependent on EGFR signaling. (F) Flow cytometry unit distribution of FSC-Area of YFP+ ISCs in response to P.e. infection. EGFR signaling and transcription factors Pnt and Ets21C are required for ISC growth. (G-I) The growth effect of EGFR signaling is independent of proliferation, and depend on MEK-ERK cascade. (G) Confocal images of posterior midguts. Scale bar is 50μM. (H) Both Stg and MEK knockdown blocked ISC proliferation, (I) but only MEK knockdown blocked cellular growth. Violin plot showing ISC cell size. Thick line represents the median and thin lines represent quartiles. See also Figure S1. (*p<0.05, **p<0.01, ***p<0.001, ****p<0.0001; ns, not significant)
