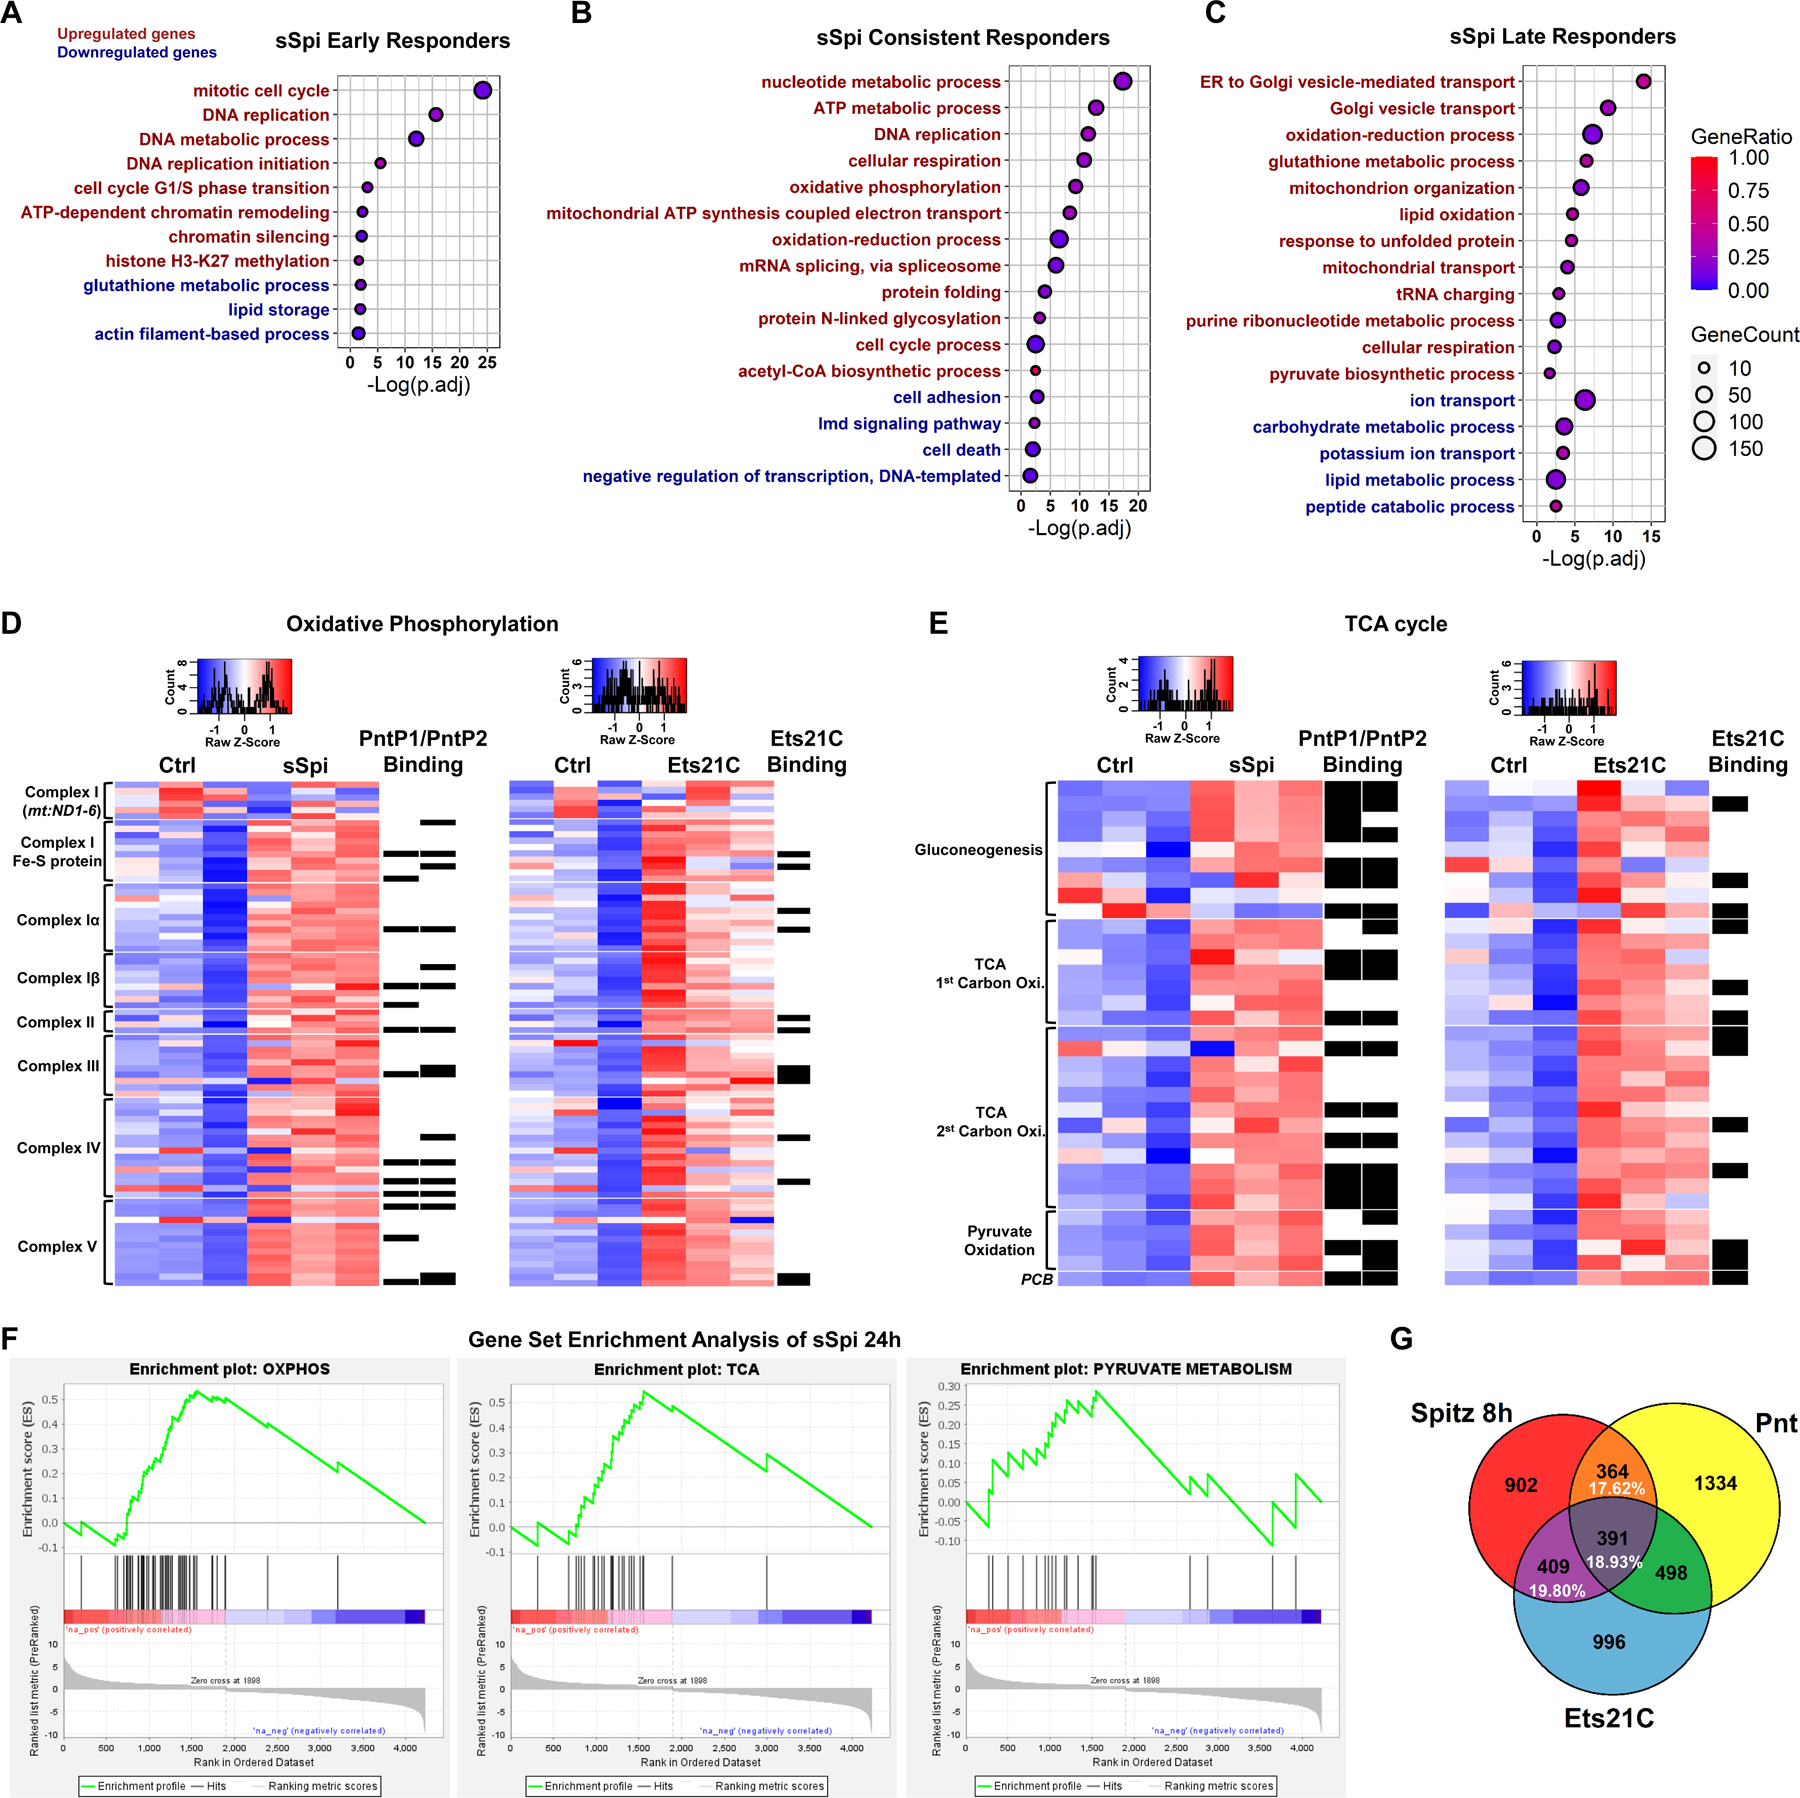
Figure 3. EGFR signaling up-regulates oxidative phosphorylation and TCA cycle genes in ISCs.

(A-C) Dot plot of selected enriched GO-terms of early, consistent, and late responder genes to sSpi over-expression, which are the genes significantly changed only at 8h, only at 24h, or at both 8h and 24h (with the same trend), respectively. For the full list of enriched GO-terms, see Data S4. Red indicates significantly enriched terms for the up-regulated gene set, while green indicates significantly enriched terms for the down-regulated gene set. The size of the dot indicates the gene count for the GO-term, and the color indicates the proportion of genes in the GO term that are significantly differentially expressed. (D-E) Heatmap of (D) OXPHOS and (E) TCA cycle genes after sSpi and Ets21C 24h over-expression. All genes with known function involved in metabolic pathways (KEGG dme00190 and dme00020) and expressed in ISCs were included. Black boxes on the right of the heatmaps indicate DamID binding for the specified TF. Transcripts per million (TPM) values were z-score normalized along rows before plotting. Genes were manually ordered. (F) Gene Set Enrichment Analysis of sSpi 24h differentially expressed genes showing OXPHOS, TCA, and Pyruvate Metabolism were significantly up-regulated. (G) Venn diagram shows that Pnt and Ets21C differentially expressed genes are essential for EGFR signaling early activation, making up to 56.35% of sSpi 8h transcription output. The overlap is significant, P=1.24e-276. See also Figure S3.
