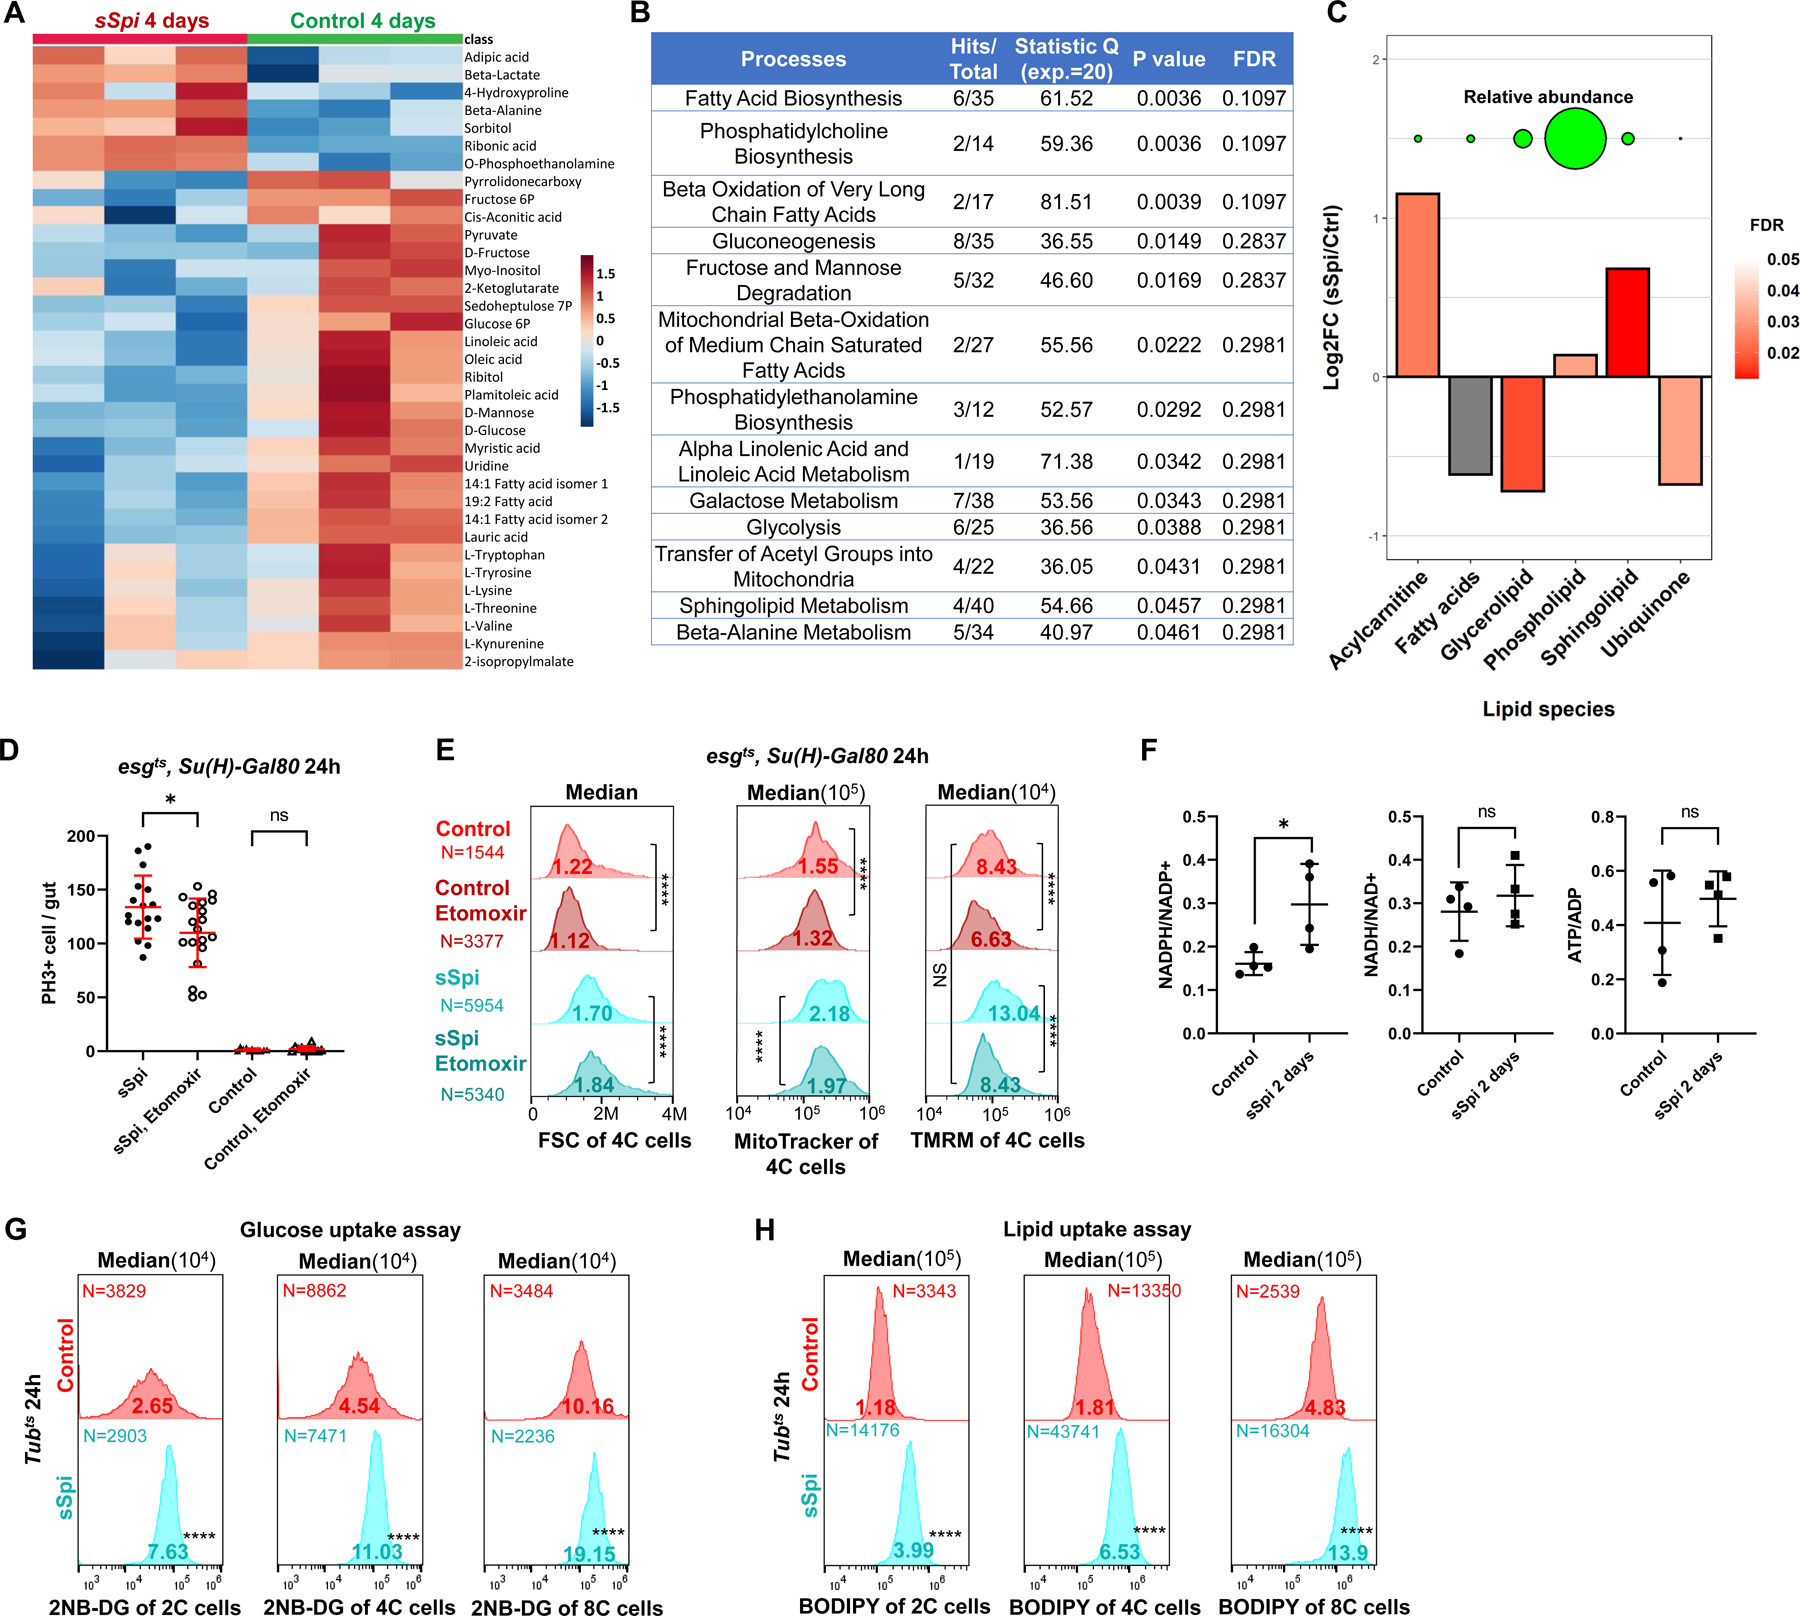
Figure 4. EGFR signaling reprograms ISC metabolism.

(A) GC-MS metabolomics profiling from 3×100 control midguts or midguts overexpressing sSpi in esg+ cells for 4 days. Heatmap of top 35 altered metabolites (Top 35 by P value). Raw data was log transformed and normalized by Pareto scaling, and then Z-scores were calculated across all samples. Each row represents one metabolite. For complete data see Data S5. (B) Enrichment analysis results of metabolomics following sSpi overexpression, from MetaboAnalystR. (C) Differences in abundance of major lipid classes after sSpi overexpression for 4 days. Y-axis represents log2 fold-changes between sSpi and control samples. For each class, mass-spectrometry peaks belonging to lipids in the class were summed. Values from control and sSpi-overexpression biological replicates were then compared via t-test. Significance is depicted by the bars’ color, with grey bars indicating that differences are not significant (p>0.05). Circles on top of the bar-plot depict the relative abundance of each lipid class in sSpi overexpression samples. For the full list of lipids, see Data S5. (D) EGFR signaling-induced ISC proliferation was repressed by CPT1 inhibition. Etomoxir (25μM), a CPT1 inhibitor, was mixed in fly food and fed to flies 36h prior to dissection. Etomoxir had no effect on control guts, but reduced mitotic cell number in sSpi-overexpressing guts. (E) Flow cytogram showing that EGFR signaling increased ISC mitochondrial membrane potential (TMRM staining), which was repressed by CPT1 inhibition. (F) The Ratios of redox and energy upon 2 days EGFR signaling activation by targeted metabolomics, NADPH/NADP+ was found to be increased. For complete data see Data S5. (G-H) Flow cytogram showing that EGFR signaling increased 2NE-DG (G) and BODIPY uptake; (H) fluorescent dodecanoic acid uptake in 2C, 4C, and 8C cells of midgut epithelial. See also Figure S4.
