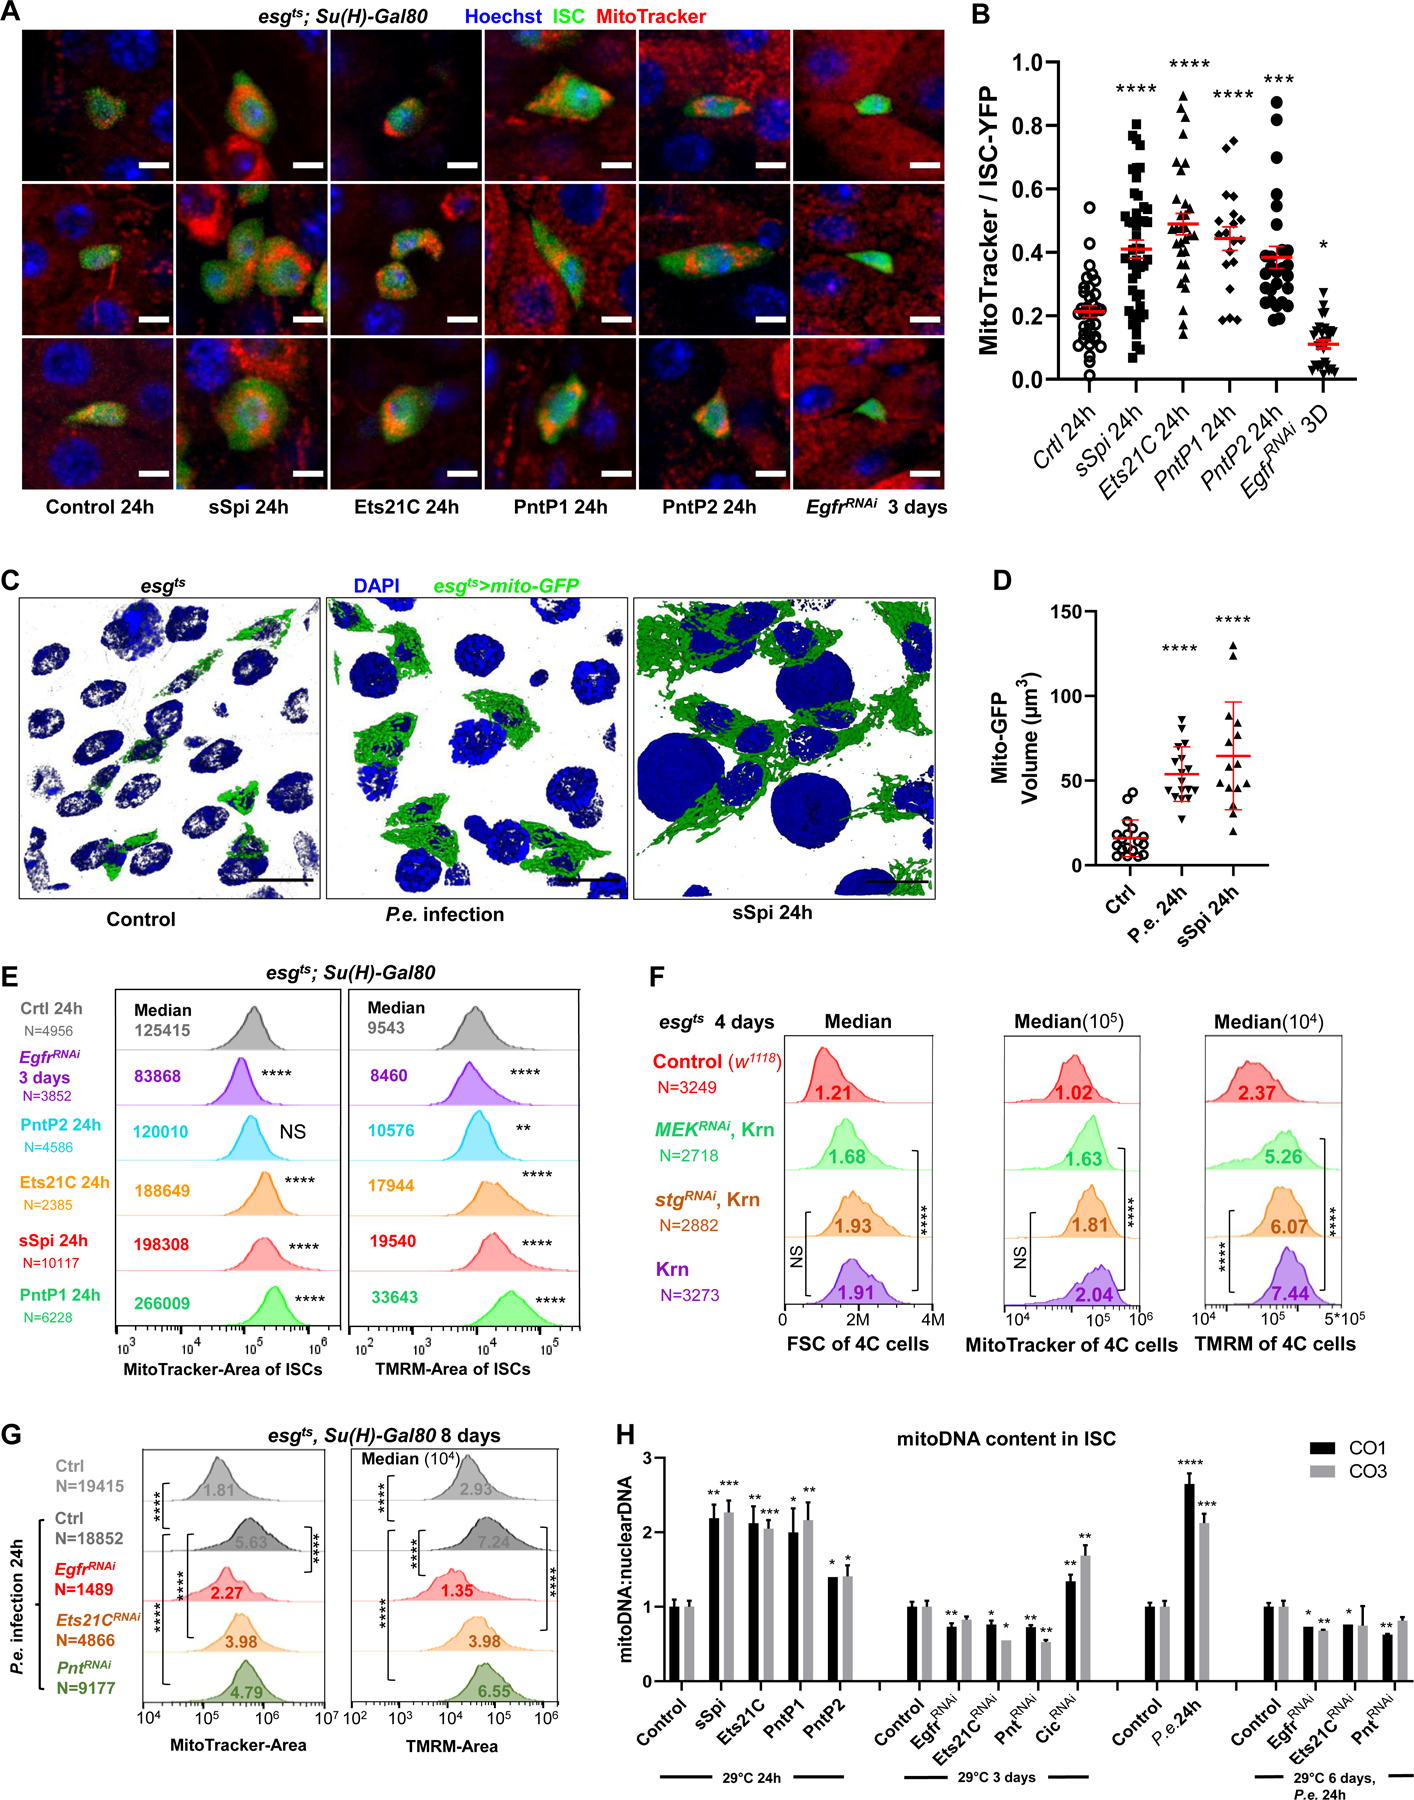
Figure 5. EGFR signaling regulates ISC growth by controlling mitochondrial biogenesis.

(A-B) Live-imaging of ISCts >YFP ISC cells (green), stained with Hoechst dye (blue), and MitoTracker dye (red). Scale bar is 5μM. The ratio of MitoTracker area to ISC-YFP area across all Z-slices of an ISC cell was calculated. Compared to controls, ISCs expressing sSpi, Ets21C, PntP1, or PntP2 for 24h had more MitoTracker stained areas relative to their cell size, while the ISCs expressing EgfrRNAi had less. (C-D) Mitochondria of progenitor cells marked by esgts >mito-GFP. The 3D re-construction of gut epithelia showed that after 24h P.e. infection or sSpi OE, the mitochondrial volume in the progenitor cells was significantly increased. Scale bar is 10μM. (E) Flow cytometry unit distribution of MitoTracker-Area and TMRM-Area of YFP positive ISCs upon activation or repression of EGFR signaling. In ISCs, sSpi, PntP1, PntP2, and Ets21C over-expression increased mitochondrial area and activity; EGFR knockdown decreased mitochondria area and activity. (F) Flow cytometry unit distribution of FSC-Area, MitoTracker-Area, and TMRM-Area of 4C state esg>GFP cells. The mitochondrial biogenesis effect of EGFR signaling is independent of proliferation, and dependent on MEK-ERK cascade. (G) Flow cytometry unit distribution of MitoTracker-Area and TMRM-Area of YFP positive ISCs. P.e. infection promoted mitochondria growth and activity, and required EGFR, Ets21C, and Pnt. (H) EGFR signaling affects Mitochondria DNA content in ISCs. Relative mitoDNA content was calculated using the DNA level of two mitochondria genes (CO1 and CO3) relative to two chromosomal genes (Ets21C and β-tub56D). qPCR was performed on total DNA samples extracted from sorted ISCs. Error bar represents SEM. See also Figure S5.
