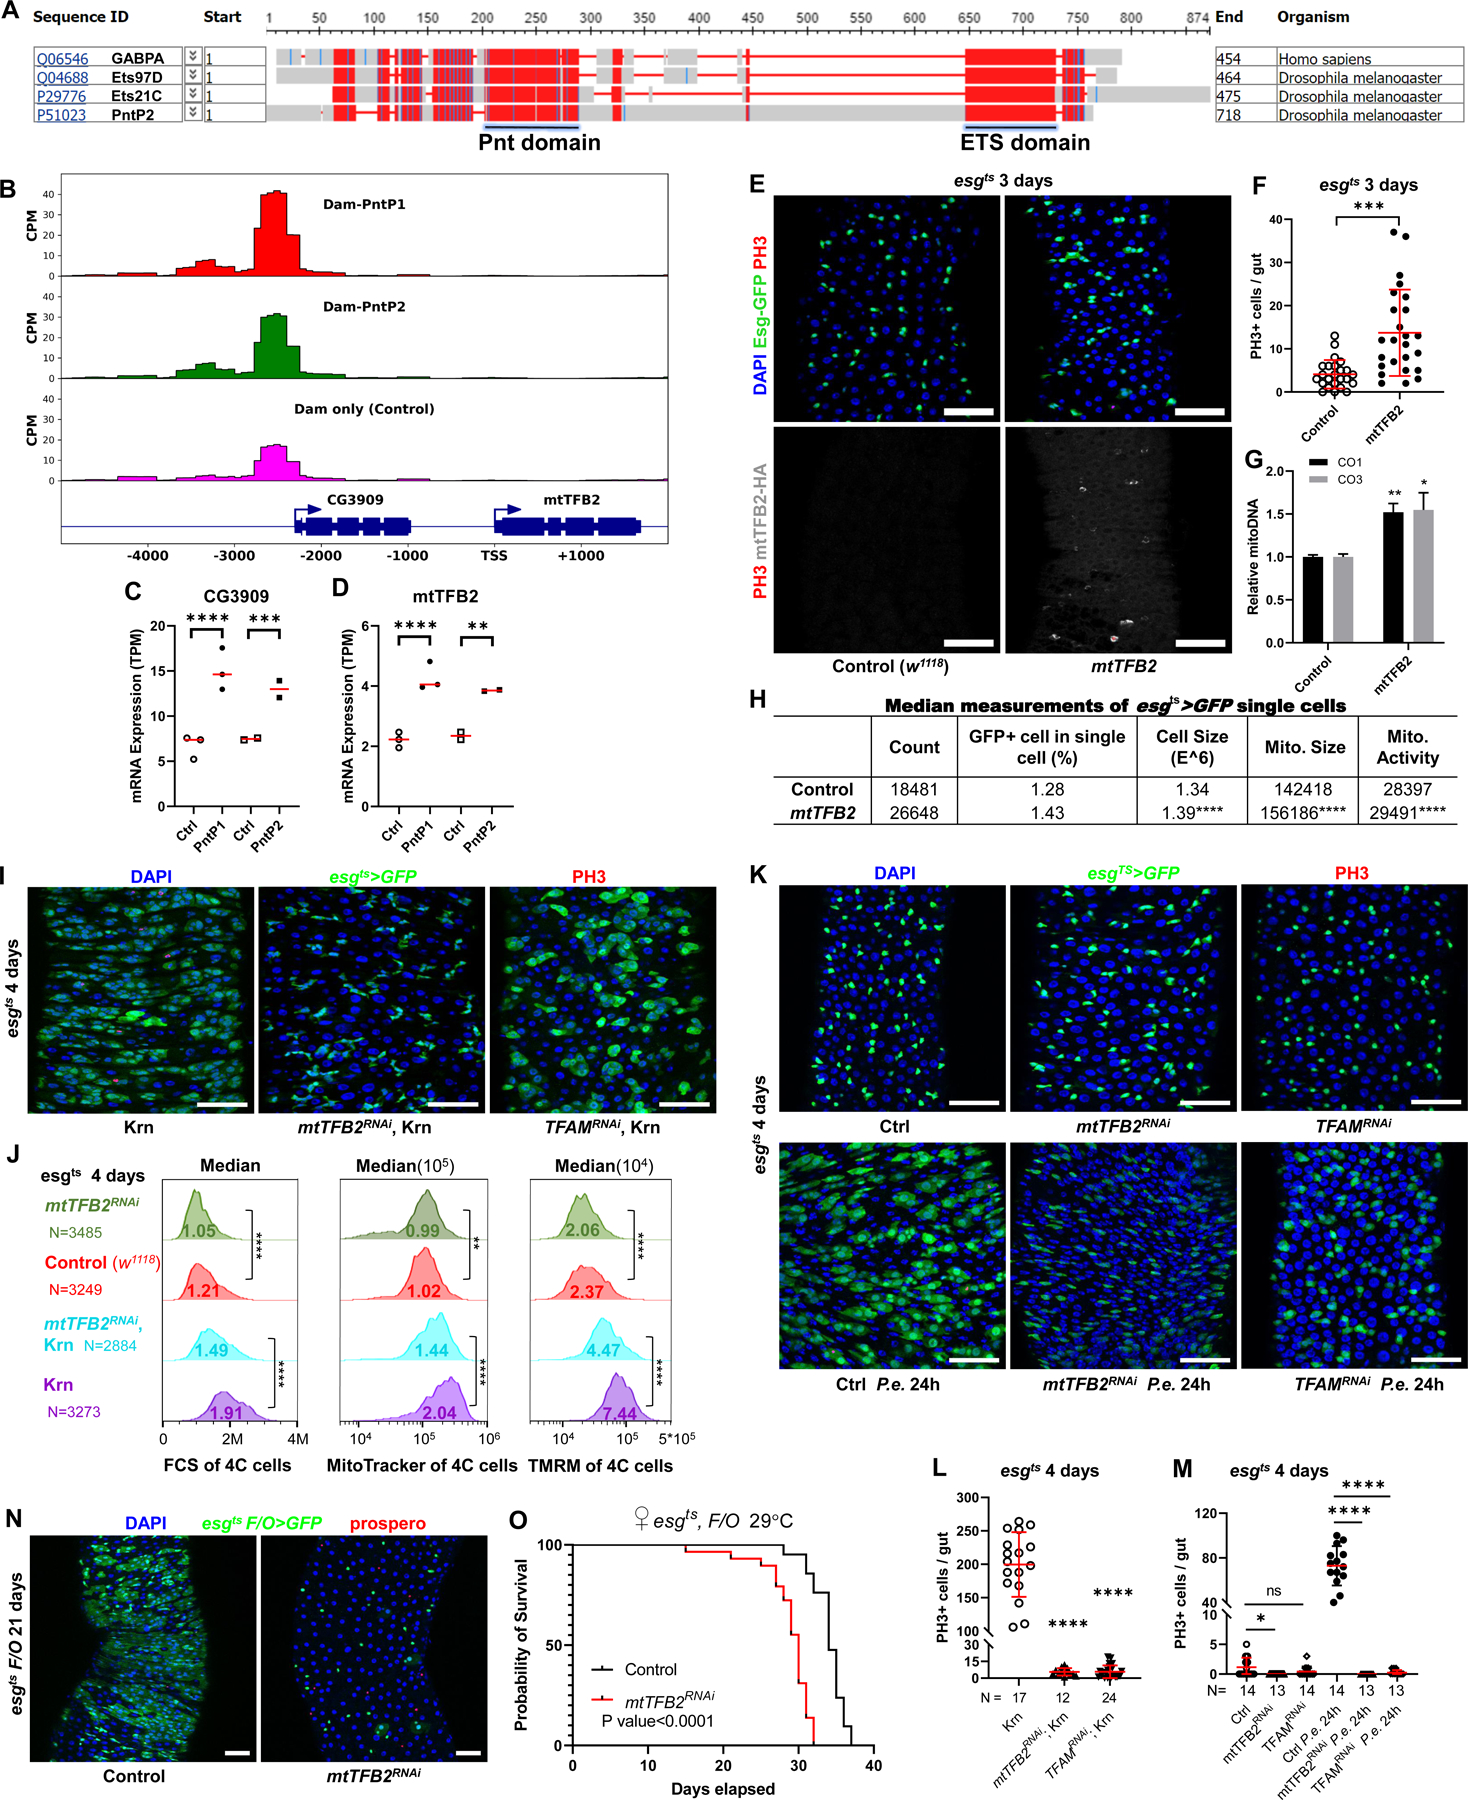
Figure 6. mtTFB2, a transcriptional target of Pnt, is required for ISC proliferation and cellular growth.

(A) COBALT Constraint-based multiple alignment (https://www.ncbi.nlm.nih.gov/tools/cobalt/cobalt.cgi) of human NRF2, Drosophila Ets97D, PntP2, and Ets21C protein showing the conserved Pnt and ETS domains. This is a column-based method that highlights highly conserved and less conserved columns based on amino acids’ relative entropy threshold. Alignment columns with no gaps are colored in red (highly conserved) or blue (less conserved). (B) DamID binding peaks (Significant peaks when compared to Dam alone control) of PntP1 and PntP2 upstream of mtTFB2 gene. (C-D) PntP1 and PntP2 up-regulated the expression of CG3909 and mtTFB2 by RNASeq. (E-F) mtTFB2 is sufficient to mildly induce ISC proliferation. Confocal images of posterior midgut. Guts were stained for GFP (green), PH3 (red), mtTFB2-HA (white), and with DAPI (blue). mtTFB2-HA protein localized distinctly in mitochondria. Scale bar is 50μM. (G) Over-expression of mtTFB2 increased mitochondria DNA content in ISCs. Relative mitoDNA content was calculated using the DNA level of two mitochondria genes (CO1 and CO3) relative to two chromosomal genes (Ets21C and β-tub56D). qPCR was performed on total DNA samples extracted from sorted ISCs. Error bar represents SEM. (H) FACS showed mtTFB2 OE increased the percentage of esgts>GFP cell in total single live cell. The FCS-Area, MitoTracker-Area, and TMRM-Area of esg+ cell over-expressing mtTFB2 were increased. (I) Knockdown of mtTFB2 or TFAM was sufficient to block proliferation induced by Krn. Confocal images of posterior midguts. Guts were stained for PH3 (red), GFP (green), and with DAPI (blue). Scale bar is 50μM. (J) Flow cytometry unit distribution of FSC-Area, MitoTracker-Area, and TMRM-Area of 4C state esgts>GFP cells. mtTFB2 knockdown impacted cell size, mitochondria size and activity in both physiological conditions and upon EGFR signaling activation. (K) mtTFB2 and TFAM are necessary for ISC proliferation induced by P.e. infection. Confocal images of posterior midguts, with and without P.e. infection. Scale bar is 50μM. (L-M) Quantification of PH3 positive cells in whole guts. (N) Image of esgts F/O driving mtTFB2 knockdown for 21 days, showing that clone formation requires mtTFB2. Scale bar is 50μM. (O) Survival assay showing that mtTFB2 knockdown in the esg lineage significantly reduced the life span of flies. See also Figure S6.
