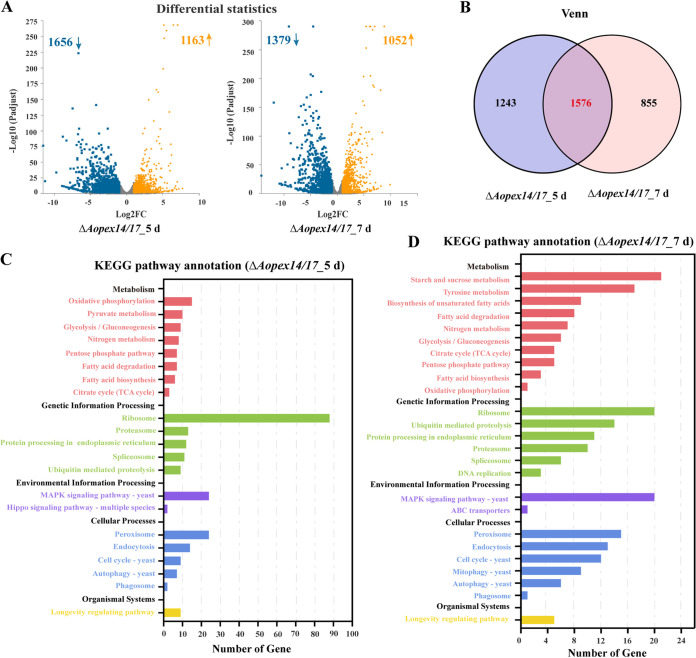
FIG 1.
Transcription analysis of wild-type (WT) and ΔAopex14/17 mutant strains. (A) Differentially expressed genes (DEGs) on days 5 and 7. Yellow, upregulated DEGs; blue, downregulated DEGs. (B) Venn diagram analysis of DEGs in ΔAopex14/17 mutant versus WT strain at 5 and 7 days. (C) KEGG analysis of ΔAopex14/17 mutant versus WT strain at 5 days. (D) KEGG analysis of ΔAopex14/17 mutant versus WT strain at 7 days. The x axis represents the number of genes, and the y axis represents the KEGG pathway.

