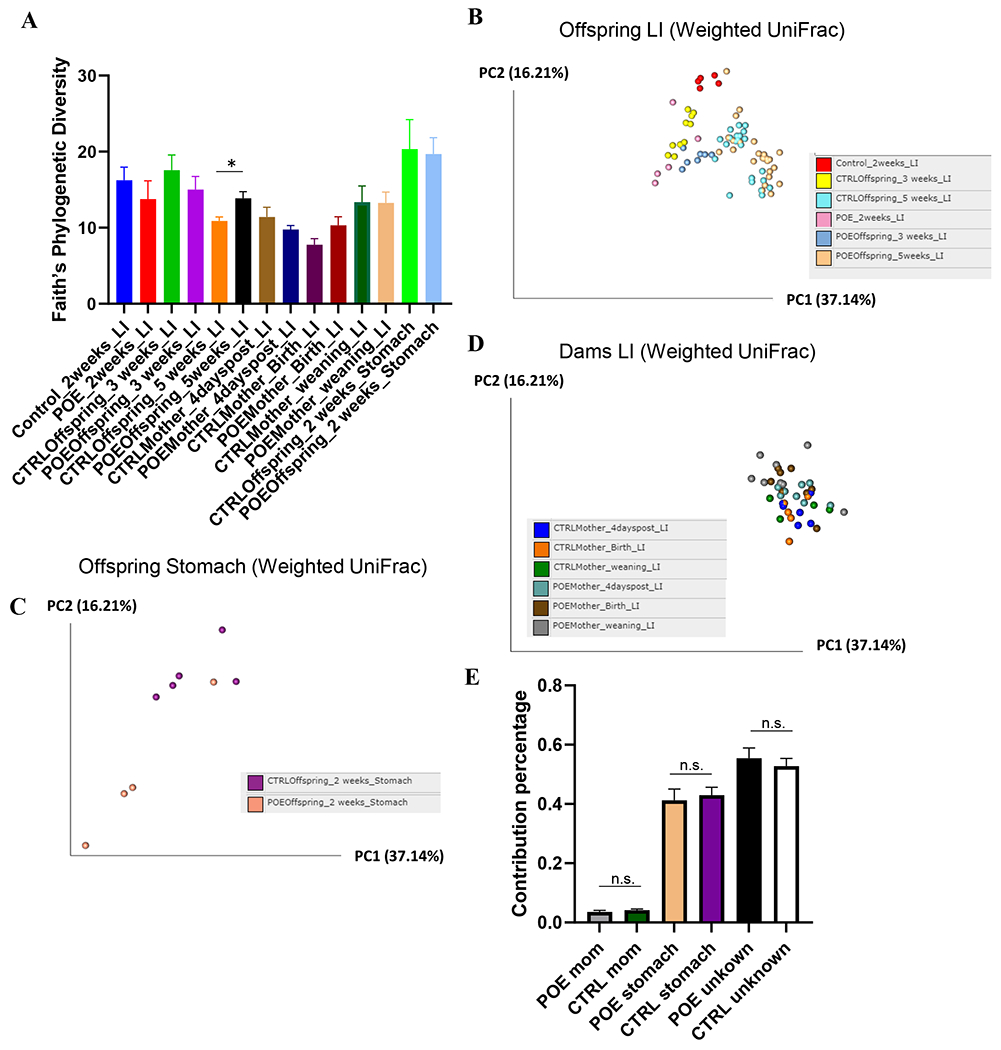
Figure 1.

Analysis of α and β-diversity of samples. Maternal fecal samples include CTRLMom_4dp (n=6), POEMom_4dp (n=8), CTRLMom_Bir (n=5), POEMom_Bir (n=8), CTRLMom_wean (n=4), and POEMom_wean (n=8). Offspring fecal samples include CTRL_2wk (n=5), POE_2wk (n=5), CTRLOff_3wk (n=10), POEOff_3wk (n=7), CTRLOff_5wk (n=22), POEOff_5wk (n=25). Offspring stomach samples include CTRLOff_2wk (n=5) and POEOff_2wk (n=5). (A) Faith Phylogenic Diversity (metric of α-diversity) at sequencing depth 20000. q > 0.05 among all groups, except in offspring at 5 weeks (q = 0.038). Principal coordinates analysis (PCoA) plot of weighted UniFrac distances (metric of β -diversity) in (B) offspring LI, (C) offspring stomach, and (D) maternal LI samples. (E) Sourcetracker estimates of the proportion of microbes in offspring stool identical to maternal stool or offspring stomach (surrogate for breastmilk). Error bars represent standard error of the mean (SEM). P>0.05 for all groups. CTRL, control; 4dp, 4 days post last hydromorphone or saline exposure (gestation day 17); Bir, birth; wean, weaning; Off, offspring; Sto, stomach; LI, large intestine; POE, prenatal opioid (hydromorphone) exposure.
