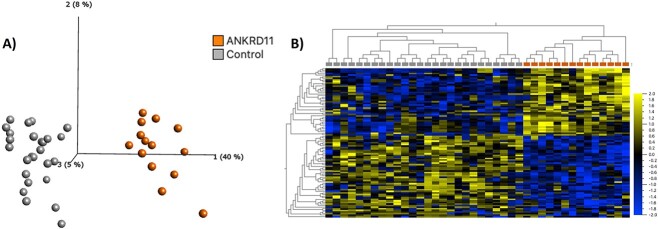
Figure 2.
Loss-of-function variants in ANKRD11 are associated with a distinct DNAm signature. (A) PCA and (B) heatmap showing clustering of the KBGS discovery subjects (n = 14) and control discovery subjects (n = 28) using DNAm values at the 95 CpG sites identified in the KBGS DNAm signature. The heatmap color gradient indicates the normalized DNAm value ranging from −2.0 (blue) to 2.0 (yellow). Euclidean distance metric is used in the heatmap clustering dendrograms.

