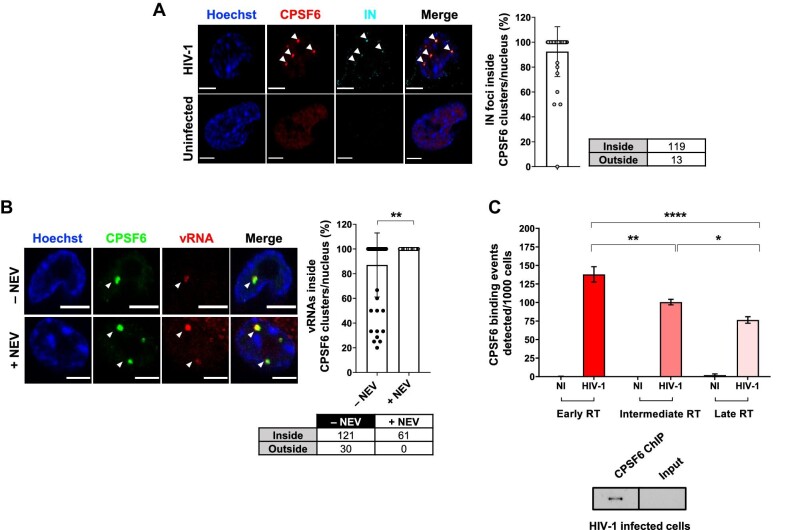
Figure 1.
CPSF6 clusters host HIV-1 viral complexes and are hubs of nuclear reverse transcription. (A) Confocal microscopy images of HIV-1-infected THP-1 cells (MOI = 10, 30 h p.i.) compared to uninfected cells. The graph shows the percentage of IN associated with CPSF6 per nucleus ± SD (40 cells, 132 IN foci). Three independent experiments were performed. (B) Confocal microscopy images of immuno-RNA FISH in HIV-1-infected THP-1 cells (MOI = 20, 2 days p.i.) treated with or without NEV (10 µM). The graph shows the percentage of vRNA foci associated with CPSF6 per cell per condition ± SD (number of cells: 56 (–NEV), 34 (+NEV); number of vRNA foci: 151 (–NEV), 61 (+NEV)). Unpaired t-test, **P ≤ 0.01. Two independent experiments were performed. (C) ChIP of endogenous CPSF6 coupled to real-time qPCR of THP-1 cells infected with HIV-1 (MOI = 5, 2 days p.i.). Different reverse transcription products were amplified and normalized on the input ± SD. NI, non-infected; RT, reverse transcription. One-way ANOVA followed by Tukey's multiple comparison test, *P ≤ 0.05, **P ≤ 0.01, ****P ≤ 0.0001. On the bottom, western blot of CPSF6 of ChIP products in HIV-1-infected cells compared to the input. Scale bar, 5 µm.

