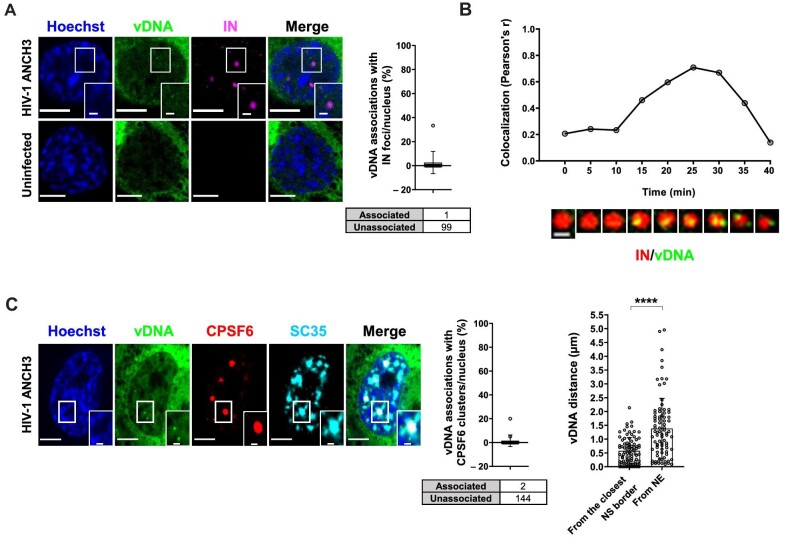
Figure 3.
Complete reverse transcribed products are released from HIV-1 MLOs. (A) Confocal images of THP-1 cells expressing OR-GFP infected with HIV-1 ANCH3 (MOI = 10, 30 h p.i.) compared to uninfected cells. The graph shows the percentage of vDNAs associated with IN per nucleus ± SD (13 cells, 100 vDNAs). Results of two independent experiments were analyzed from 3D acquisitions. (B) Cropped frames from a time-lapse microscopy (Supplementary Video S3) of vDNA (green) and IN (red) dynamics in THP-1 cells (HIV-1 ANCH3 GIR, 80 h p.i.). Pearson's correlation of the two signals per 2D frame along the time. Representative of three independent experiments. Scale bar, 1 µm. (C) Confocal images of THP-1 cells expressing OR-GFP infected with HIV-1 ANCH3 (MOI = 10, 3 days p.i.). The graphs display the percentage of vDNA associated with CPSF6 clusters per nucleus ± SD (17 cells, 146 vDNAs) and the distance of each vDNA from the closest NE point or SC35-marked NS border ± SD (7 cells, 83 vDNAs). Results of two biological replicates were analyzed from 3D aquisitions. Unpaired t-test, ****P ≤ 0.0001. Scale bar, 5 µm.

