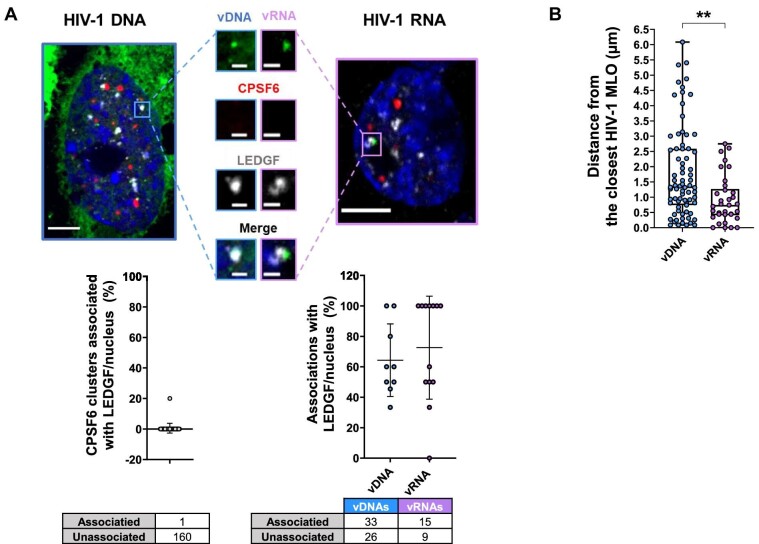
Figure 6.
HIV-1 active proviruses locate in LEDGF-marked chromatin neighboring HIV-1 MLOs. (A) Confocal images of THP-1 cells expressing OR-GFP infected with HIV-1 ANCH3 (MOI = 10, 3 days p.i.) and expressing MCP-GFP infected with HIV-1 ANCH3 MS2 (MOI = 2.5, 3 days p.i.). On the bottom, the plots show the percentage of CPSF6 clusters associated with LEDGF per nucleus ± SD (38 cells, 161 CPSF6) and the percentage of vDNA or vRNA associated with LEDGF cluster per nucleus ± SD. Two independent experiments were performed. (B) Scatter plot shows the distance of vDNA or vRNA from the border of the closest HIV-1 MLO (SC35 + CPSF6) ± SD (75 vDNAs, 7 cells; 34 vRNAs, 8 cells). Unpaired t-test, **P ≤ 0.01. Results of two biological replicates were analyzed from 3D acquisitions. Scale bar, 5 µm. Inset, 1 µm.

