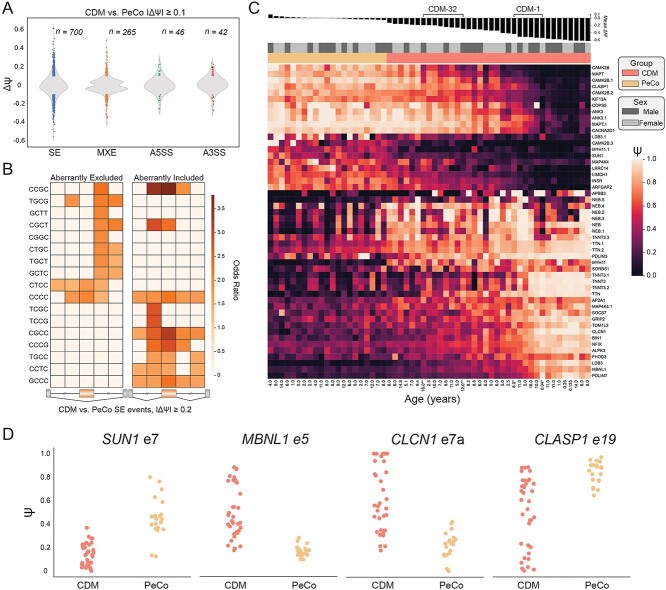
Figure 2.
Analysis of alternative splicing dysregulation in CDM individuals compared with age-matched pediatric controls. (A) Violin plot displaying distribution of splicing dysregulation based on ΔΨ compared with all PeCo samples. Events significantly dysregulated (ΔΨ ≥ 0.1, FDR ≤ 0.05) within each AS category, including skipped exons (SE), mutually exclusive exons (MXE), alternative 5′ splice sites (A5SS) and alternative 3′ splice sites (A3SS), are annotated as colored circles. The number of each AS event type is listed above. (B) Heatmap showing enrichment of k-mers (k = 4) around the 194 most significantly dysregulated skipped exons (CDM versus PeCo, |ΔΨ| ≥ 0.2, FDR ≤ 0.05). Columns from left to right denote the intronic region from +1 to +300 bp and −300 to −1 bp of the upstream intron, the skipped exon itself, and the intronic region from +1 to +300 bp and −300 to −1 bp of the downstream intron. (C) Heatmap displaying estimated Ψ of top 50 significantly dysregulated SE events between CDM and PeCo groups (CDM versus PeCo, |ΔΨ| ≥ 0.1, FDR ≤ 0.05). Rows (SE events) were subjected to hierarchical clustering, while columns (individual samples) were ranked by mean ΔΨ of these 50 events as shown above. Sample group, sex, and age at biopsy are also listed. CDM repeat biopsies are annotated as * (CDM-1) and ** (CDM-32). (D) Ψ values of specific skipped exon events for CDM and PeCo samples.

