Figure 3.
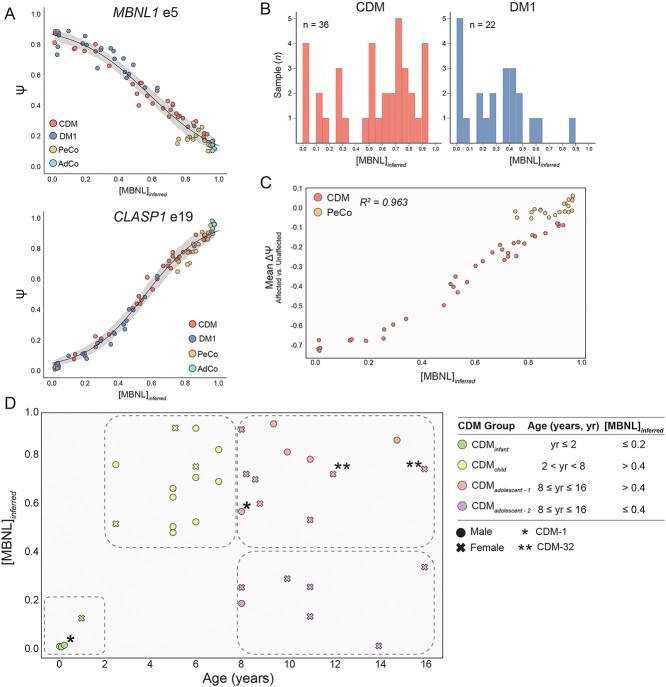
[MBNL]inferred captures dynamic variability of splicing dysregulation within CDM skeletal muscle transcriptomes during pediatric development. (A) Percent spliced in (PSI, Ψ) values derived from Affected (CDM and DM1) versus Unaffected (PeCo and AdCo) comparison for MBNL1 e5 and CLASP1 e19 plotted against [MBNL]inferred. Ψ values for individuals in each sample group are differentiated by color, and 95% confidence of estimated Ψ value at a given [MBNL]inferred is shown in gray. (B) Bar graph displaying distribution of calculated [MBNL]inferred for CDM and DM1 cohorts. (C) [MBNL]inferred of CDM and PeCo samples correlates with total splicing dysregulation as estimated by mean ΔΨ of top 50 most significantly dysregulated SE events (Affected versus Unaffected |ΔΨ| ≥ 0.1, FDR ≤ 0.05). R2 value is reported. (D) Scatter plot of [MBNL]inferred for CDM patients versus age at biopsy. Individual sample’s sex and classification within outlined CDM groups is displayed as described in associated table legend. Table outlines age and [MBNL]inferred inclusion criteria for four CDM subcohorts: CDMinfant, CDMchild, CDMadolescent-1 and CDMadolescent-2. These inclusion criteria are also visually annotated on scatter plot with boundaries of circled groupings. CDM repeat biopsies are annotated as * (CDM-1) and ** (CDM-32).

