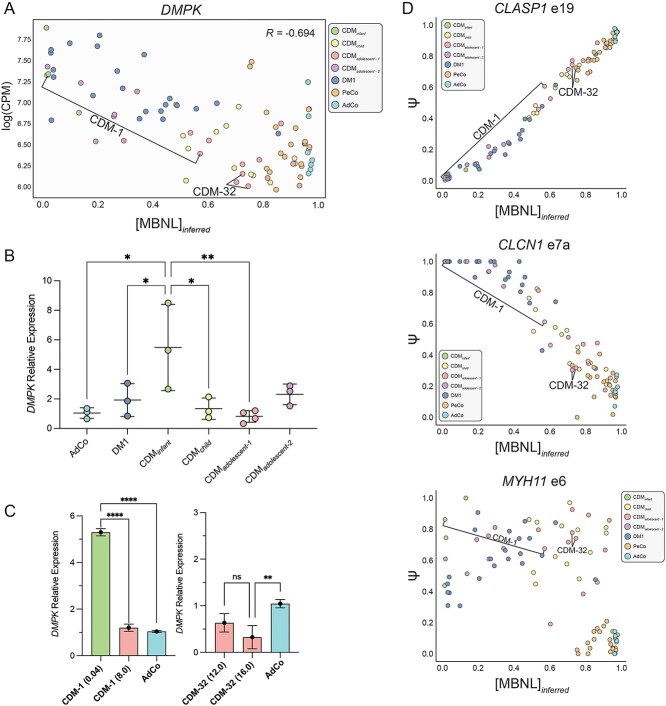
Figure 6.
Variable DMPK expression within CDM subcohorts correlates with MBNL-dependent mis-splicing signature conserved between all adult-onset DM1 and CDM individuals. (A) Scatter plot of DMPK expression levels within all sample groups as detected by RNA-seq (logCPM) plotted against [MBNL]inferred. Pearson correlation is reported and CDM repeat biopsies are annotated. (B) Aligned dot plot of DMPK relative expression normalized to GAPDH as measured by qPCR of all CDM subcohorts, DM1, and AdCo. Results are expressed as mean ± standard deviation; one-way ANOVA with Tukey’s post hoc analysis; *P < 0.05; **P < 0.005. Unless annotated, relative expression from all comparisons was not significant. (C) Relative fold-change in expression of DMPK in CDM-1 and CDM-32 repeat biopsies at the first and second collection compared with AdCo as measured by qPCR. Age at collection for each sample is listed in brackets (years) and bars are colored according to assigned CDM subcohort. Results are expressed as mean ± standard deviation; one-way ANOVA with Tukey’s post-hoc analysis; **P < 0.005; ****P < 0.0001. Unless annotated, relative expression from all comparisons was not significant (ns). (D) Percent spliced in (PSI, Ψ) values of three skipped exon events mis-spliced in DM1 and all CDM subcohorts. Ψ values derived from comparisons between each affected group and associated age-matched controls (|ΔΨ| ≥ 0.1, FDR ≤ 0.05).

