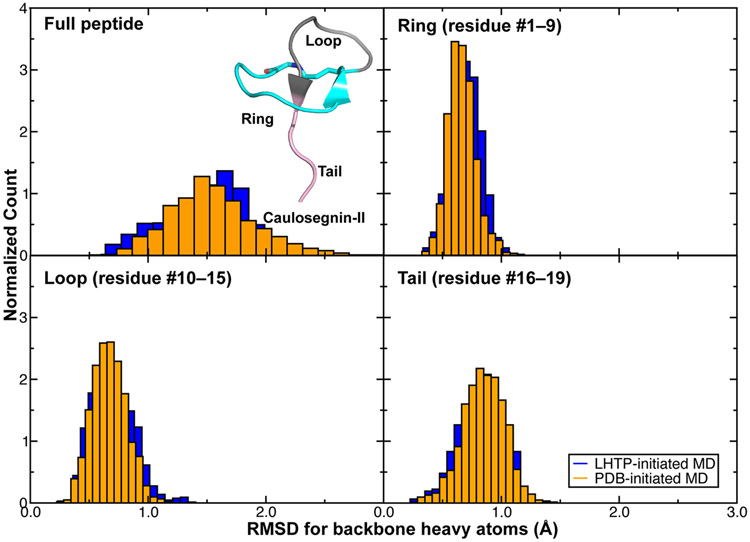
Figure 5.
Distribution of RMSD for LassoHTP-initiated and PDB-initiated MD conformational ensemble for caulosegnin-II. Both ensembles are constructed by 1000 snapshots that are evenly extracted from 100 ns MD trajectories. The RMSD distributions for the full peptide as well as sub-structures (i.e., ring, loop, and tail) are shown. A cartoon representation of caulosegnin-II is shown in the inset with the ring, loop, and tail colored in cyan, gray, and pink. For both ensembles, RMSD was calculated using backbone atoms (i.e., Cα, N, C, and O) with reference to the experimentally-determined PDB crystal structure.

