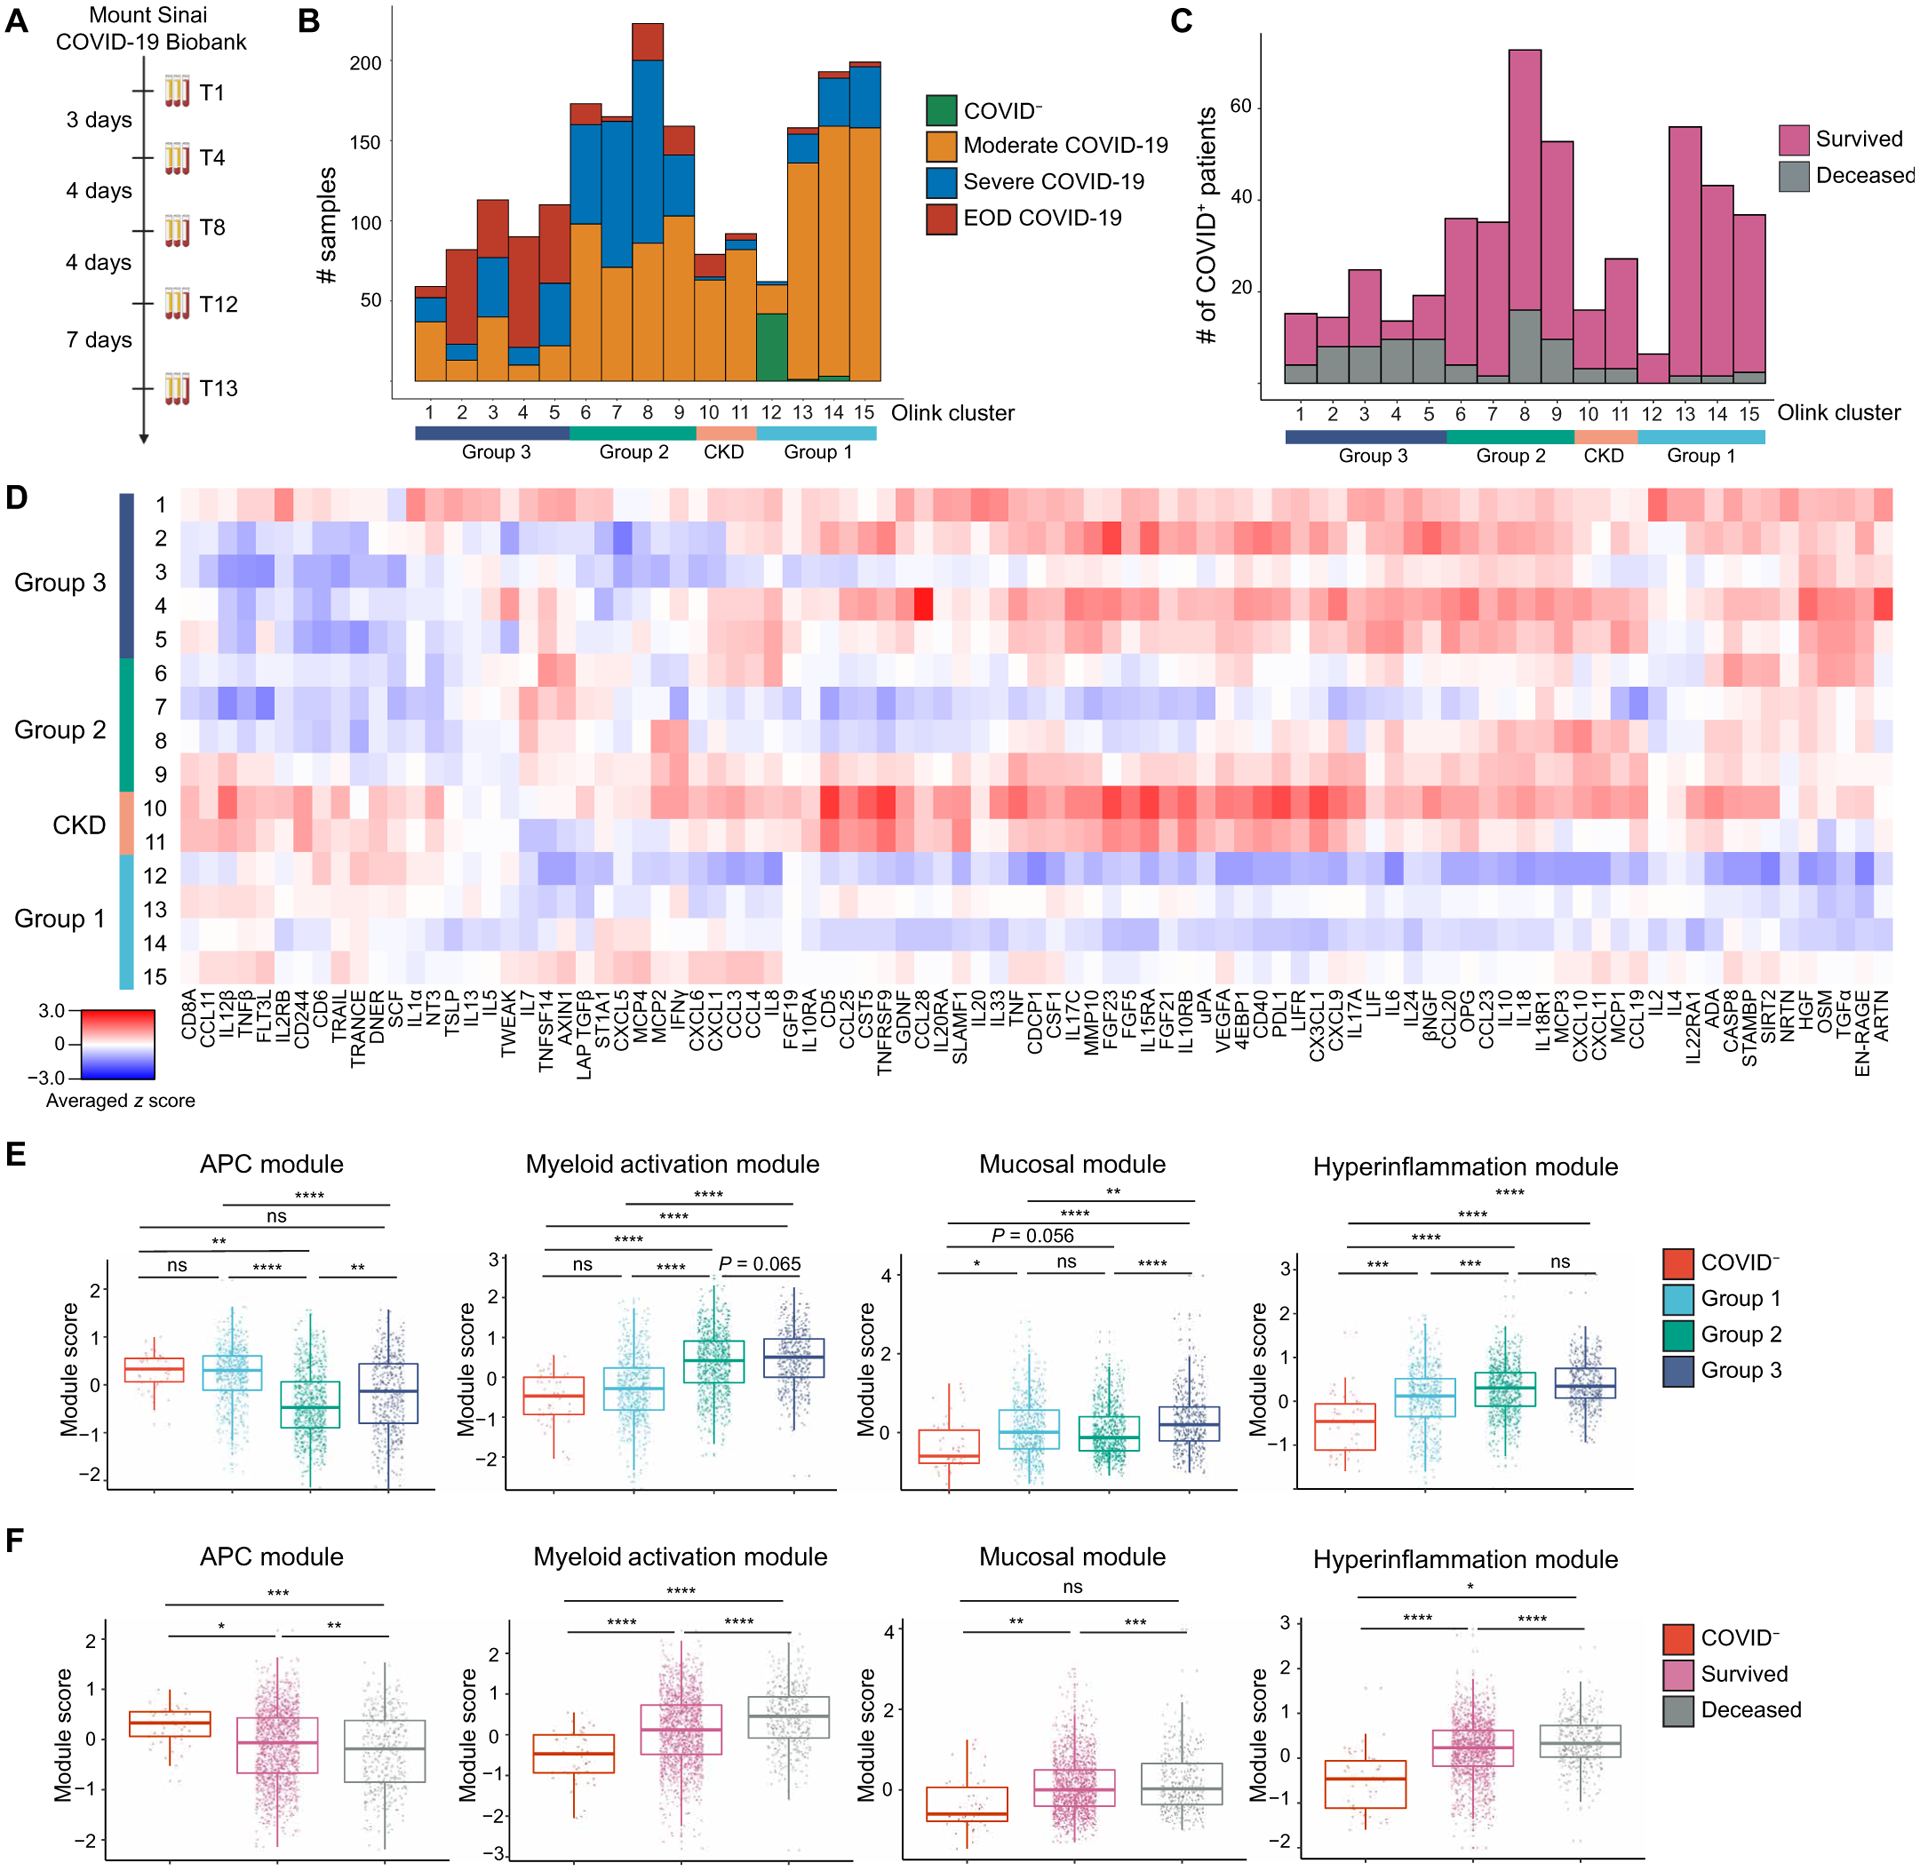
Fig. 1. Proteomic characterization of COVID-19 serum reveals distinct immune patterns associated with disease severity and clinical outcome.

(A) Mount Sinai COVID-19 Biobank serum collection scheme. (B) Histogram of patient samples across Olink clusters and Olink group is shown, denoted by clinical severity classification (n = 2001). (C) Histogram of first available COVID+ patient samples across Olink clusters and Olink group is shown, denoted by final clinical outcome (n = 583). (D) An averaged z score heatmap is shown of Olink inflammation panel analytes across Olink clusters. Olink clusters were grouped on the basis of clinical severity, projected outcome, and comorbidity distribution (n = 2001). (E) The boxplots showing Olink module score comparisons of all Olink samples by Olink group (n = 2001). (F) The boxplots show Olink module score comparisons of all Olink samples by the final clinical outcome (n = 2001). For box plots, each dot represents a patient sample; the center line indicates the median; box limits indicate the 25th and 75th percentile; whiskers indicate 1.5× inter-quartile range. The scheme in (A) was created with BioRender.com. COVID− samples were obtained from healthy volunteers (B and D to F). Statistical significance in (E) and (F) is determined by two-way ANOVA with Tukey’s multiple comparisons correction. ns, not significant; *adj. P < 0.05; **adj. P < 0.01; ***adj. P < 0.001; ****adj. P < 0.0001.
