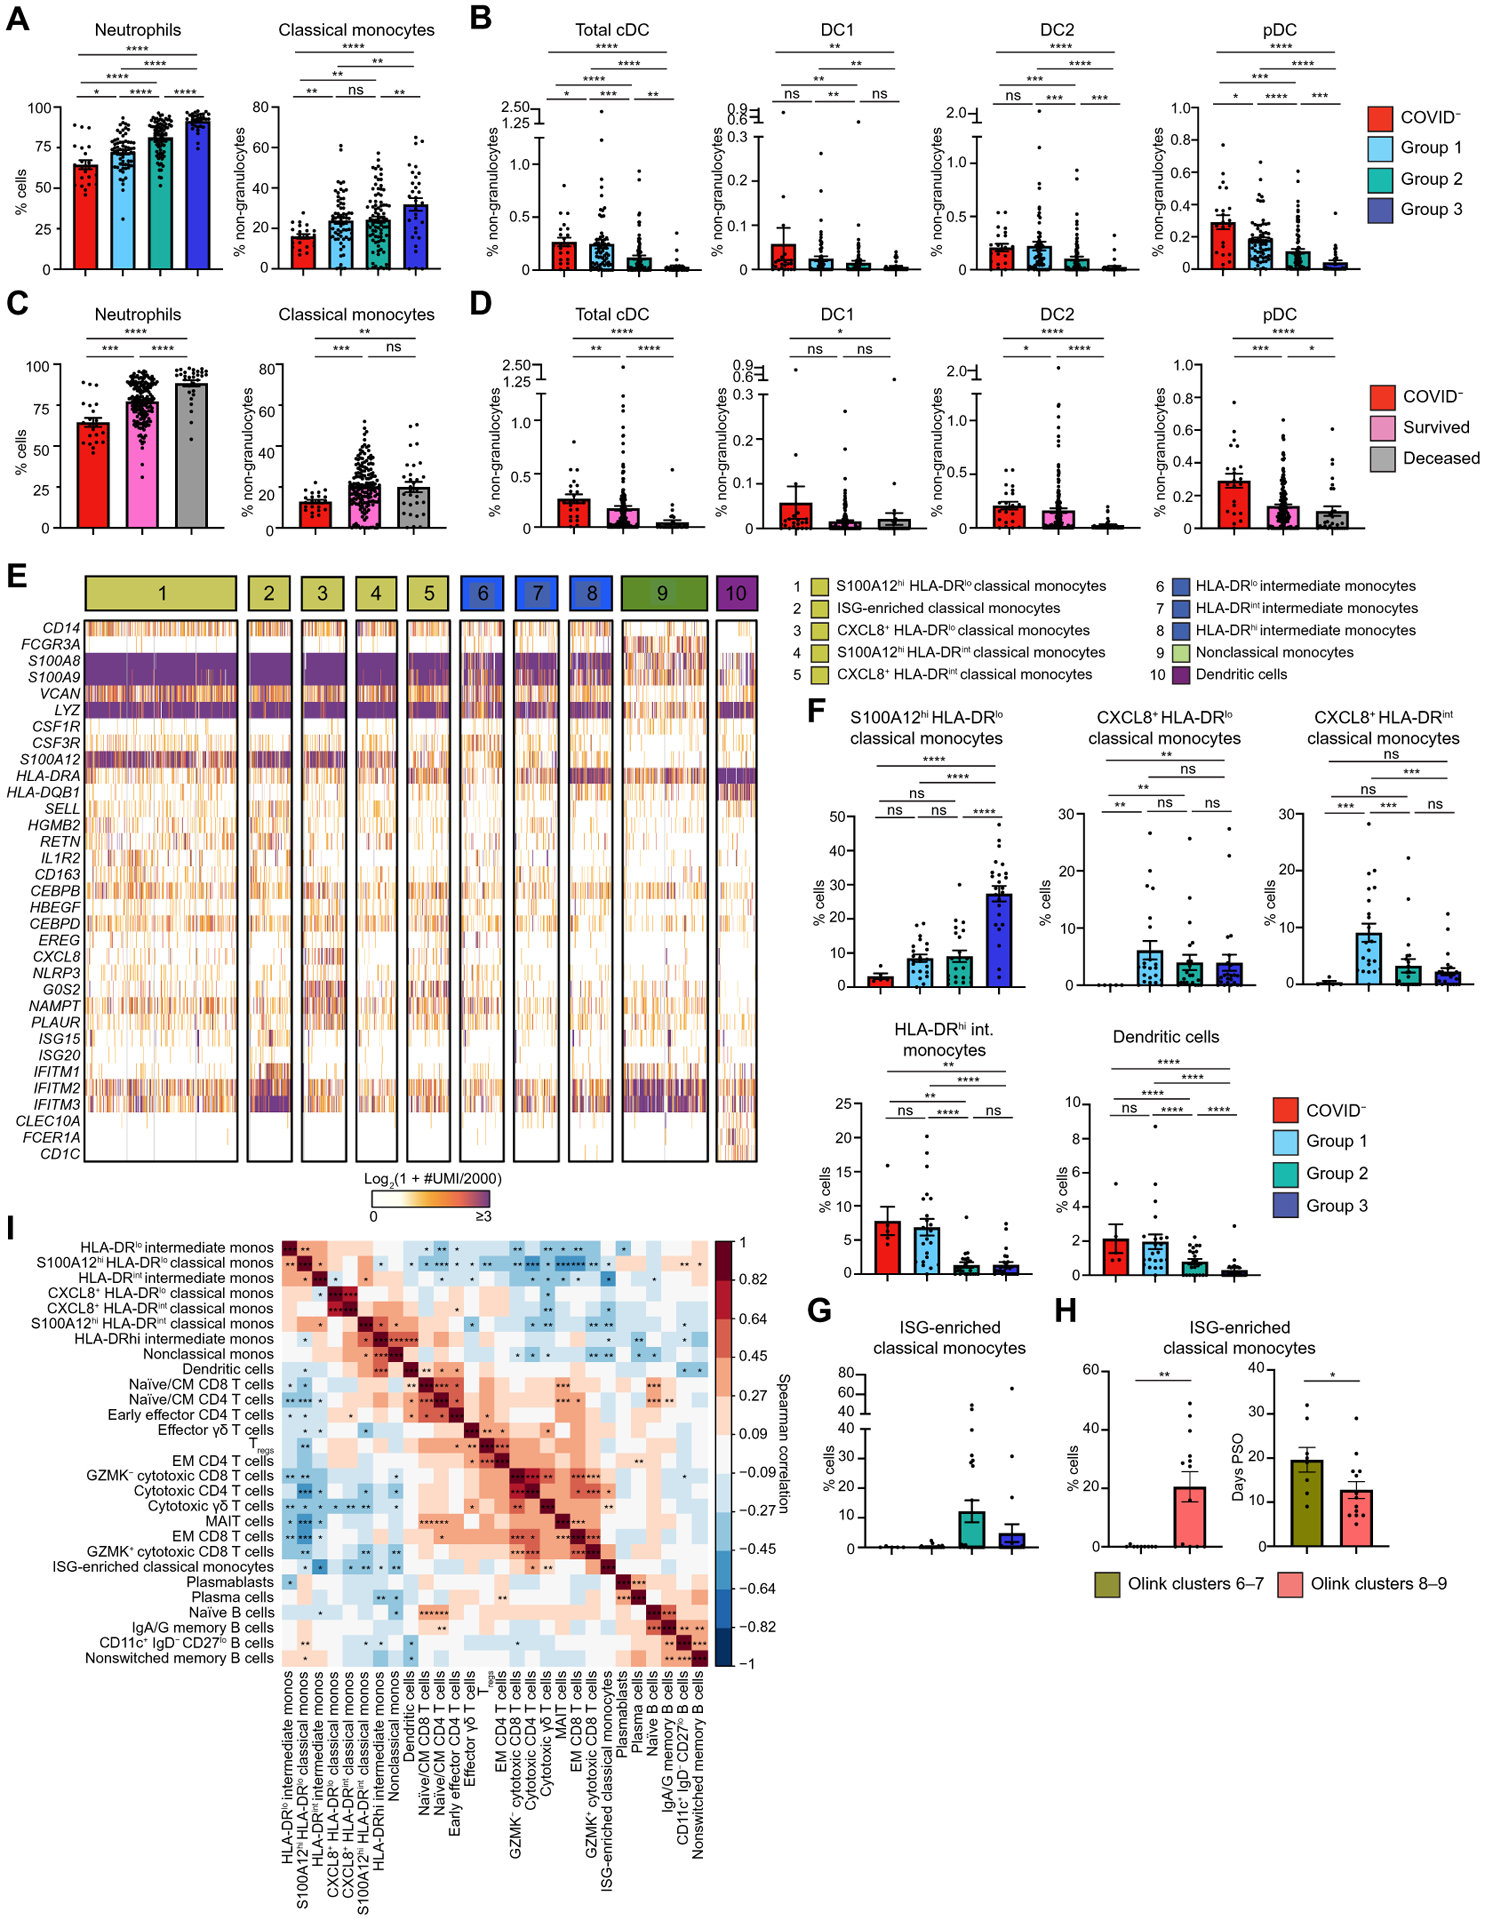
Fig. 2. Immature inflammatory myeloid cells are associated with increased COVID-19 severity.

(A) The frequency of neutrophils (% cells) and classical monocytes (% non-granulocytes) in whole blood were measured by CyTOF and separated by Olink group (n = 206). (B) DC population frequencies (% non-granulocytes) in whole blood were measured by CyTOF and separated by Olink group (n = 206). Conventional DC (cDC), conventional type 1 DC (DC1), conventional type 2 DC (DC2), and plasmacytoid DC (pDC) are shown. (C) Neutrophils (% cells) and classical monocyte frequencies (% non-granulocytes) in whole blood are shown on the basis of the final clinical outcome and were measured by CyTOF (n = 214). (D) DC population frequencies (% non-granulocytes) in whole blood are shown on the basis of the final clinical outcome and were measured by CyTOF (n = 214). (E) The heatmap shows unique molecular identifier (UMI) counts of selected genes from myeloid cell scRNAseq clusters from PBMCs. (F) scRNAseq cluster cell frequencies in indicated Olink groups are shown as percent of cells by Olink group (G) Frequencies of ISG-enriched classical monocytes are shown clustered by Olink group (n = 75). (H) ISG-enriched classical monocyte cell frequencies and days PSO are shown separated by clusters 6 and 7 versus clusters 8 and 9 (n = 10). (I) The matrix heatmap shows Spearman correlation coefficients between identified scRNAseq PBMC cell clusters (n = 81). Monos, monocytes. (*P < 0.05; **P < 0.01; ***P < 0.001). For bar graphs (A to D and F to H), each dot represents a patient sample. COVID− samples were obtained from healthy volunteers (A to G and I). Statistical significance (A to D and F and G) was determined by Kruskal-Wallis followed by the multiple comparisons test with false discovery rate correction. ns, not significant; *q < 0.05; **q < 0.01; ***q < 0.001; ****q < 0.0001. Statistical significance in (H) was determined by the Mann-Whitney test; *P < 0.05; **P < 0.01.
