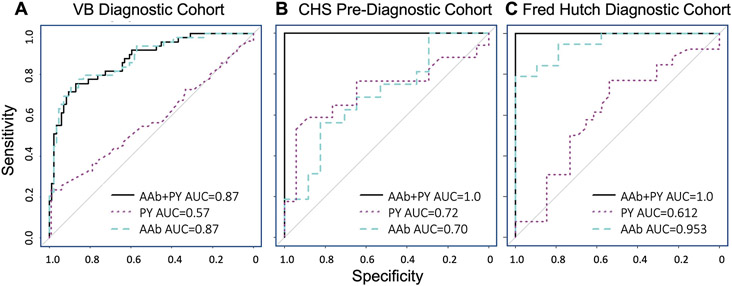
Figure 7. A risk prediction model can accurately detect SCLC.
(A to C) Receiver operating characteristic (ROC) curves are shown for the 5-autoantibody (AAb, blue dashed line) complex panel identified by maximizing AUC in the Vanderbilt (VB) dataset (A), then fixing the coefficients and testing in the Cardiovascular Health Study (CHS) (B) and Fred Hutch (C) cohorts. ROC curves are also shown for pack years (PY, purple dotted line) and the combination of pack years and 5-AAb panel (black solid line).

