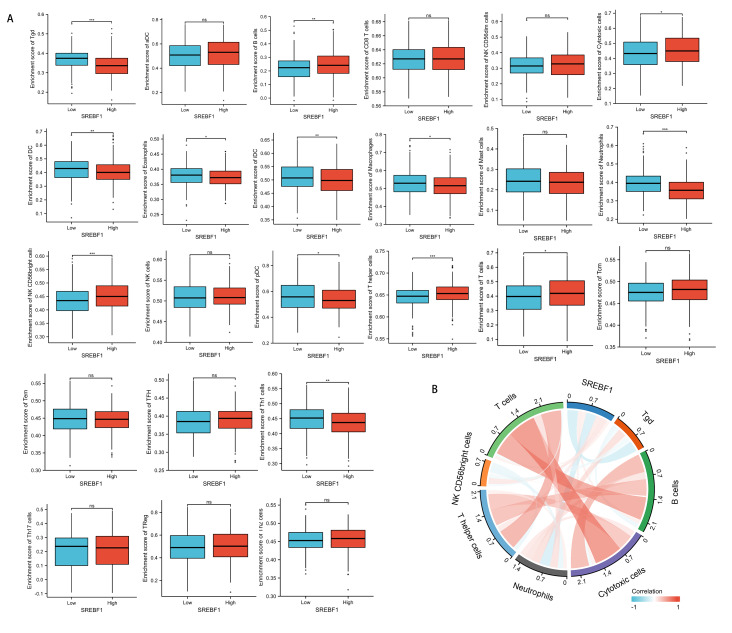
Figure 5. SREBF1 expression and immune cell infiltration in HNSC are correlated.
(A) Comparison of immune cell infiltration levels between SREBF1 differentially expressed groups in TCGA cohort of HNSC. (B) Correlation between SREBF1 and immune cell infiltration levels; red represents a positive correlation, green represents a negative correlation, and color shades represent the strength of the correlation. The data are presented as the mean ± standard deviation. *P < 0.05, **P < 0.01, ***P < 0.001. ns, not significant.

