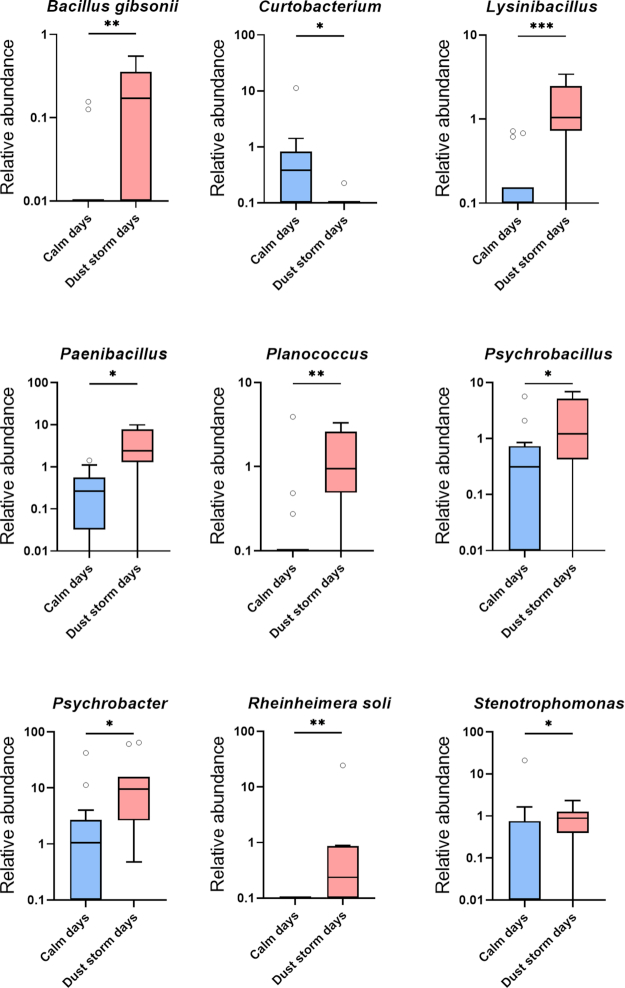
Figure 4.
The impact of dust storms on the relative abundance of the culturable atmospheric bacterial microbiome. Genera and species of bacterial microbiome with statistical significance in abundance between calm and dust storm daysare shown (*P < 0.05, **P < 0.01, ***P < 0.001, ****P < 0.0001). The Wilcoxon Rank-Sum test was used to determine statistical significance, followed by the Benjamini–Hochberg procedure to correct the P values. Data are represented as boxplots, which extend from the 25th to 75th percentiles and the line in the middle of the box represents the median.

