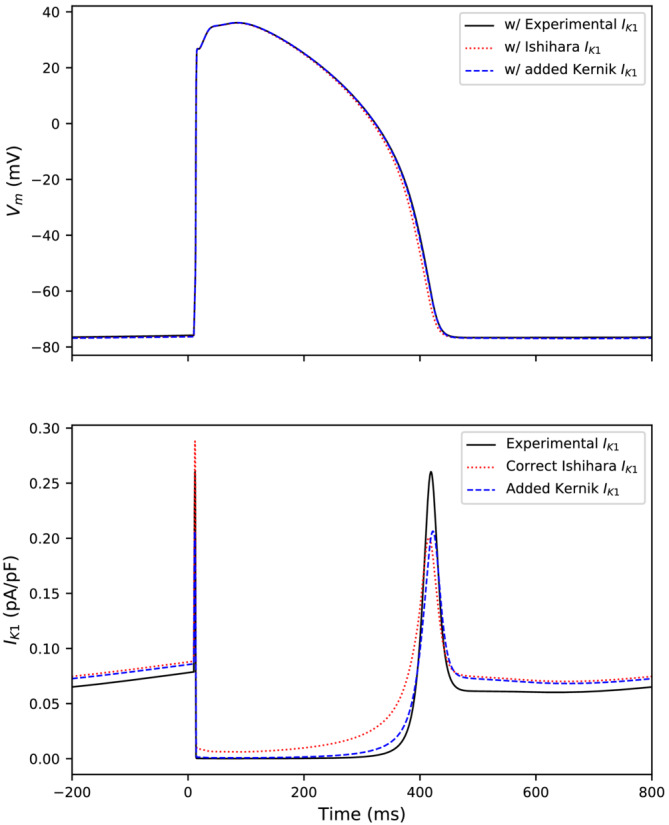
FIGURE 2.

Top: Action potentials with IK1 current increased until spontaneous behavior stopped and then paced at 1 Hz. Action potentials from the Kernik–Clancy model with the incorrect dynamically clamped IK1 used in our experiments (black, solid), the correct Ishihara IK1 (red, dotted), and the baseline Kernik‐Clancy model with increased IK1 (blue, dashed). Bottom: The IK1 for each of these models
