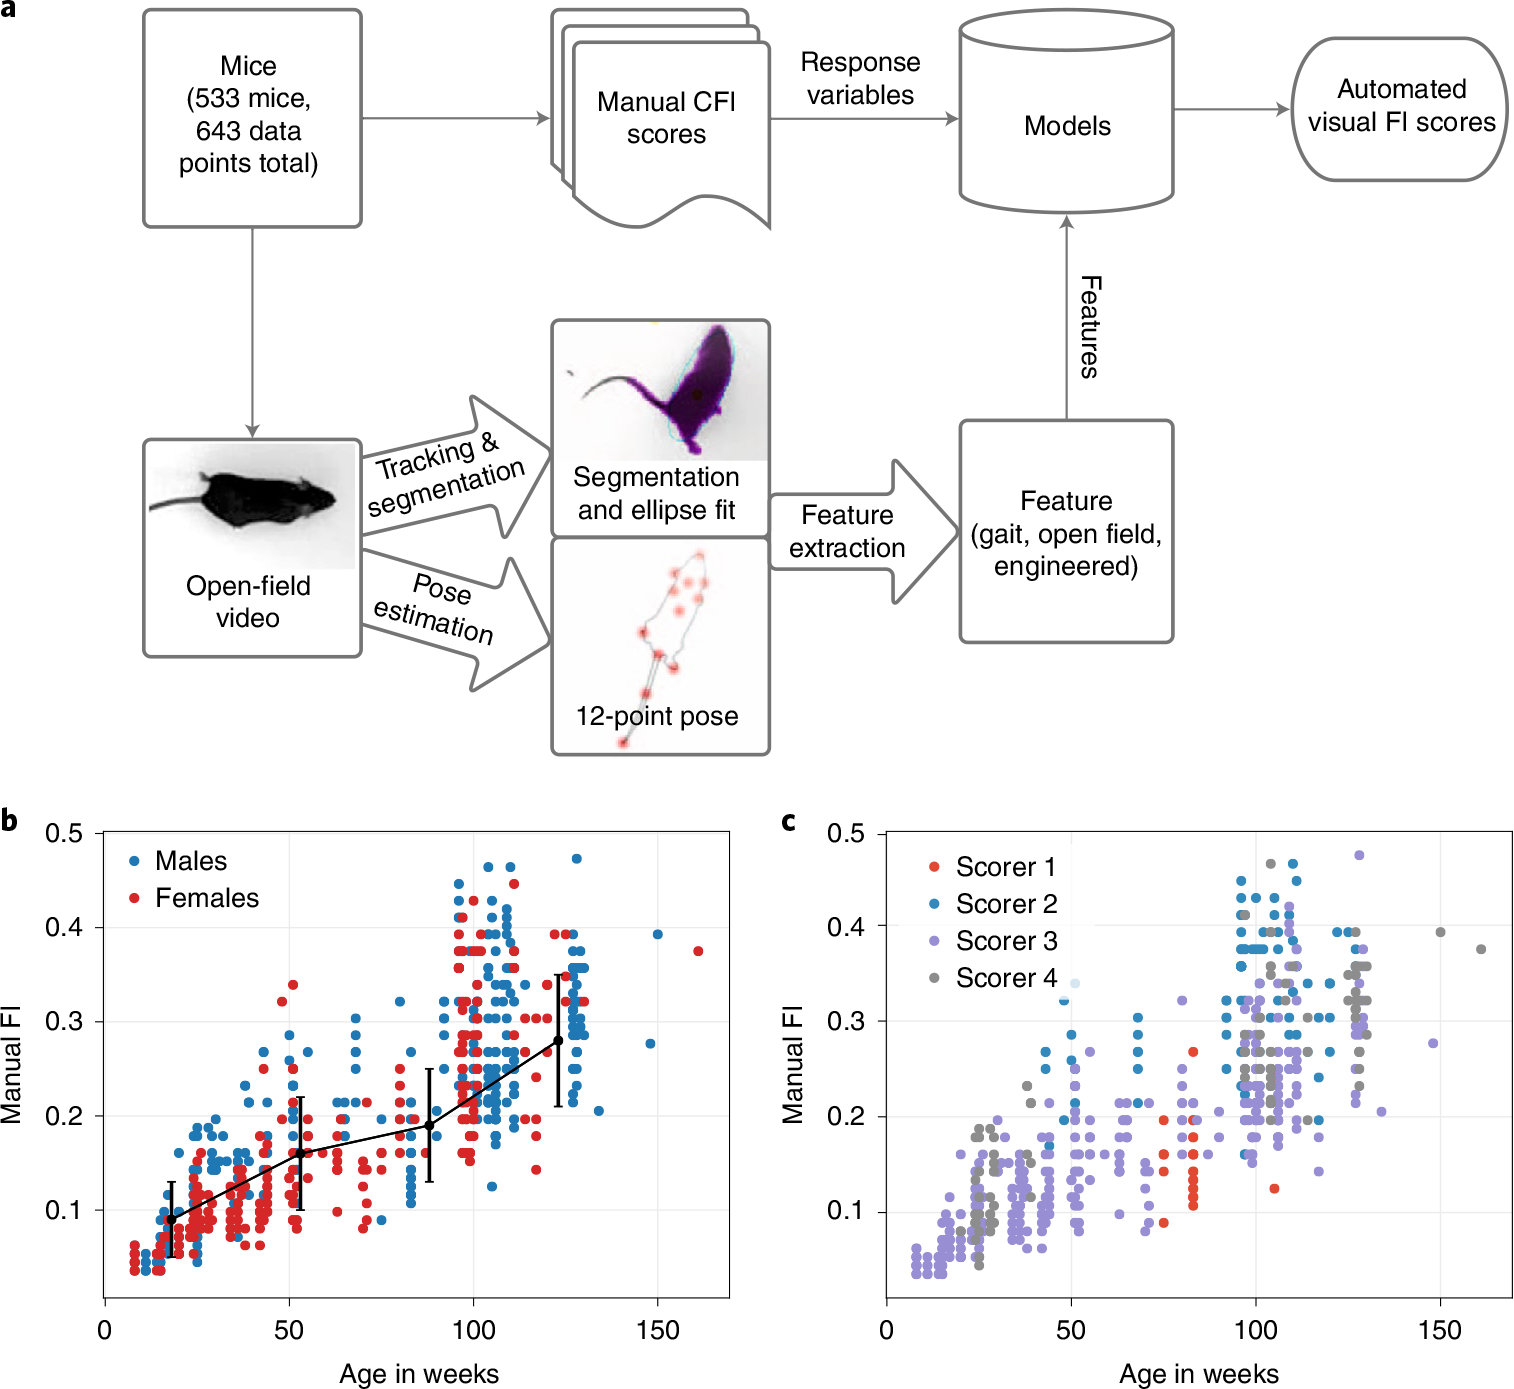
Fig. 1 |. Approach overview to build a visual frailty index.

a, Pipeline for automated vFI. Top-down videos of the open field for each mouse are processed by a tracking and segmentation network and a pose estimation network. The resulting frame-by-frame ellipse-fits and 12-point pose coordinates are further processed to produce per-video metrics for the mouse. The mouse is also manually frailty indexed to produce an FI score. The video features for each mouse are used to model its FI score. b, Distribution of FI score by age. The black line shows a piece-wise linear fit (n = 160, 146, 50, 287 mice) to the data. The center point is the mean, and the error bars are the s.d. values. c, Effect of scorer on FI data; 42% of the variability in manual FI scores was due to a scorer effect (RLRT = 183.85, P < 2.2 × 10⁻¹⁶).
