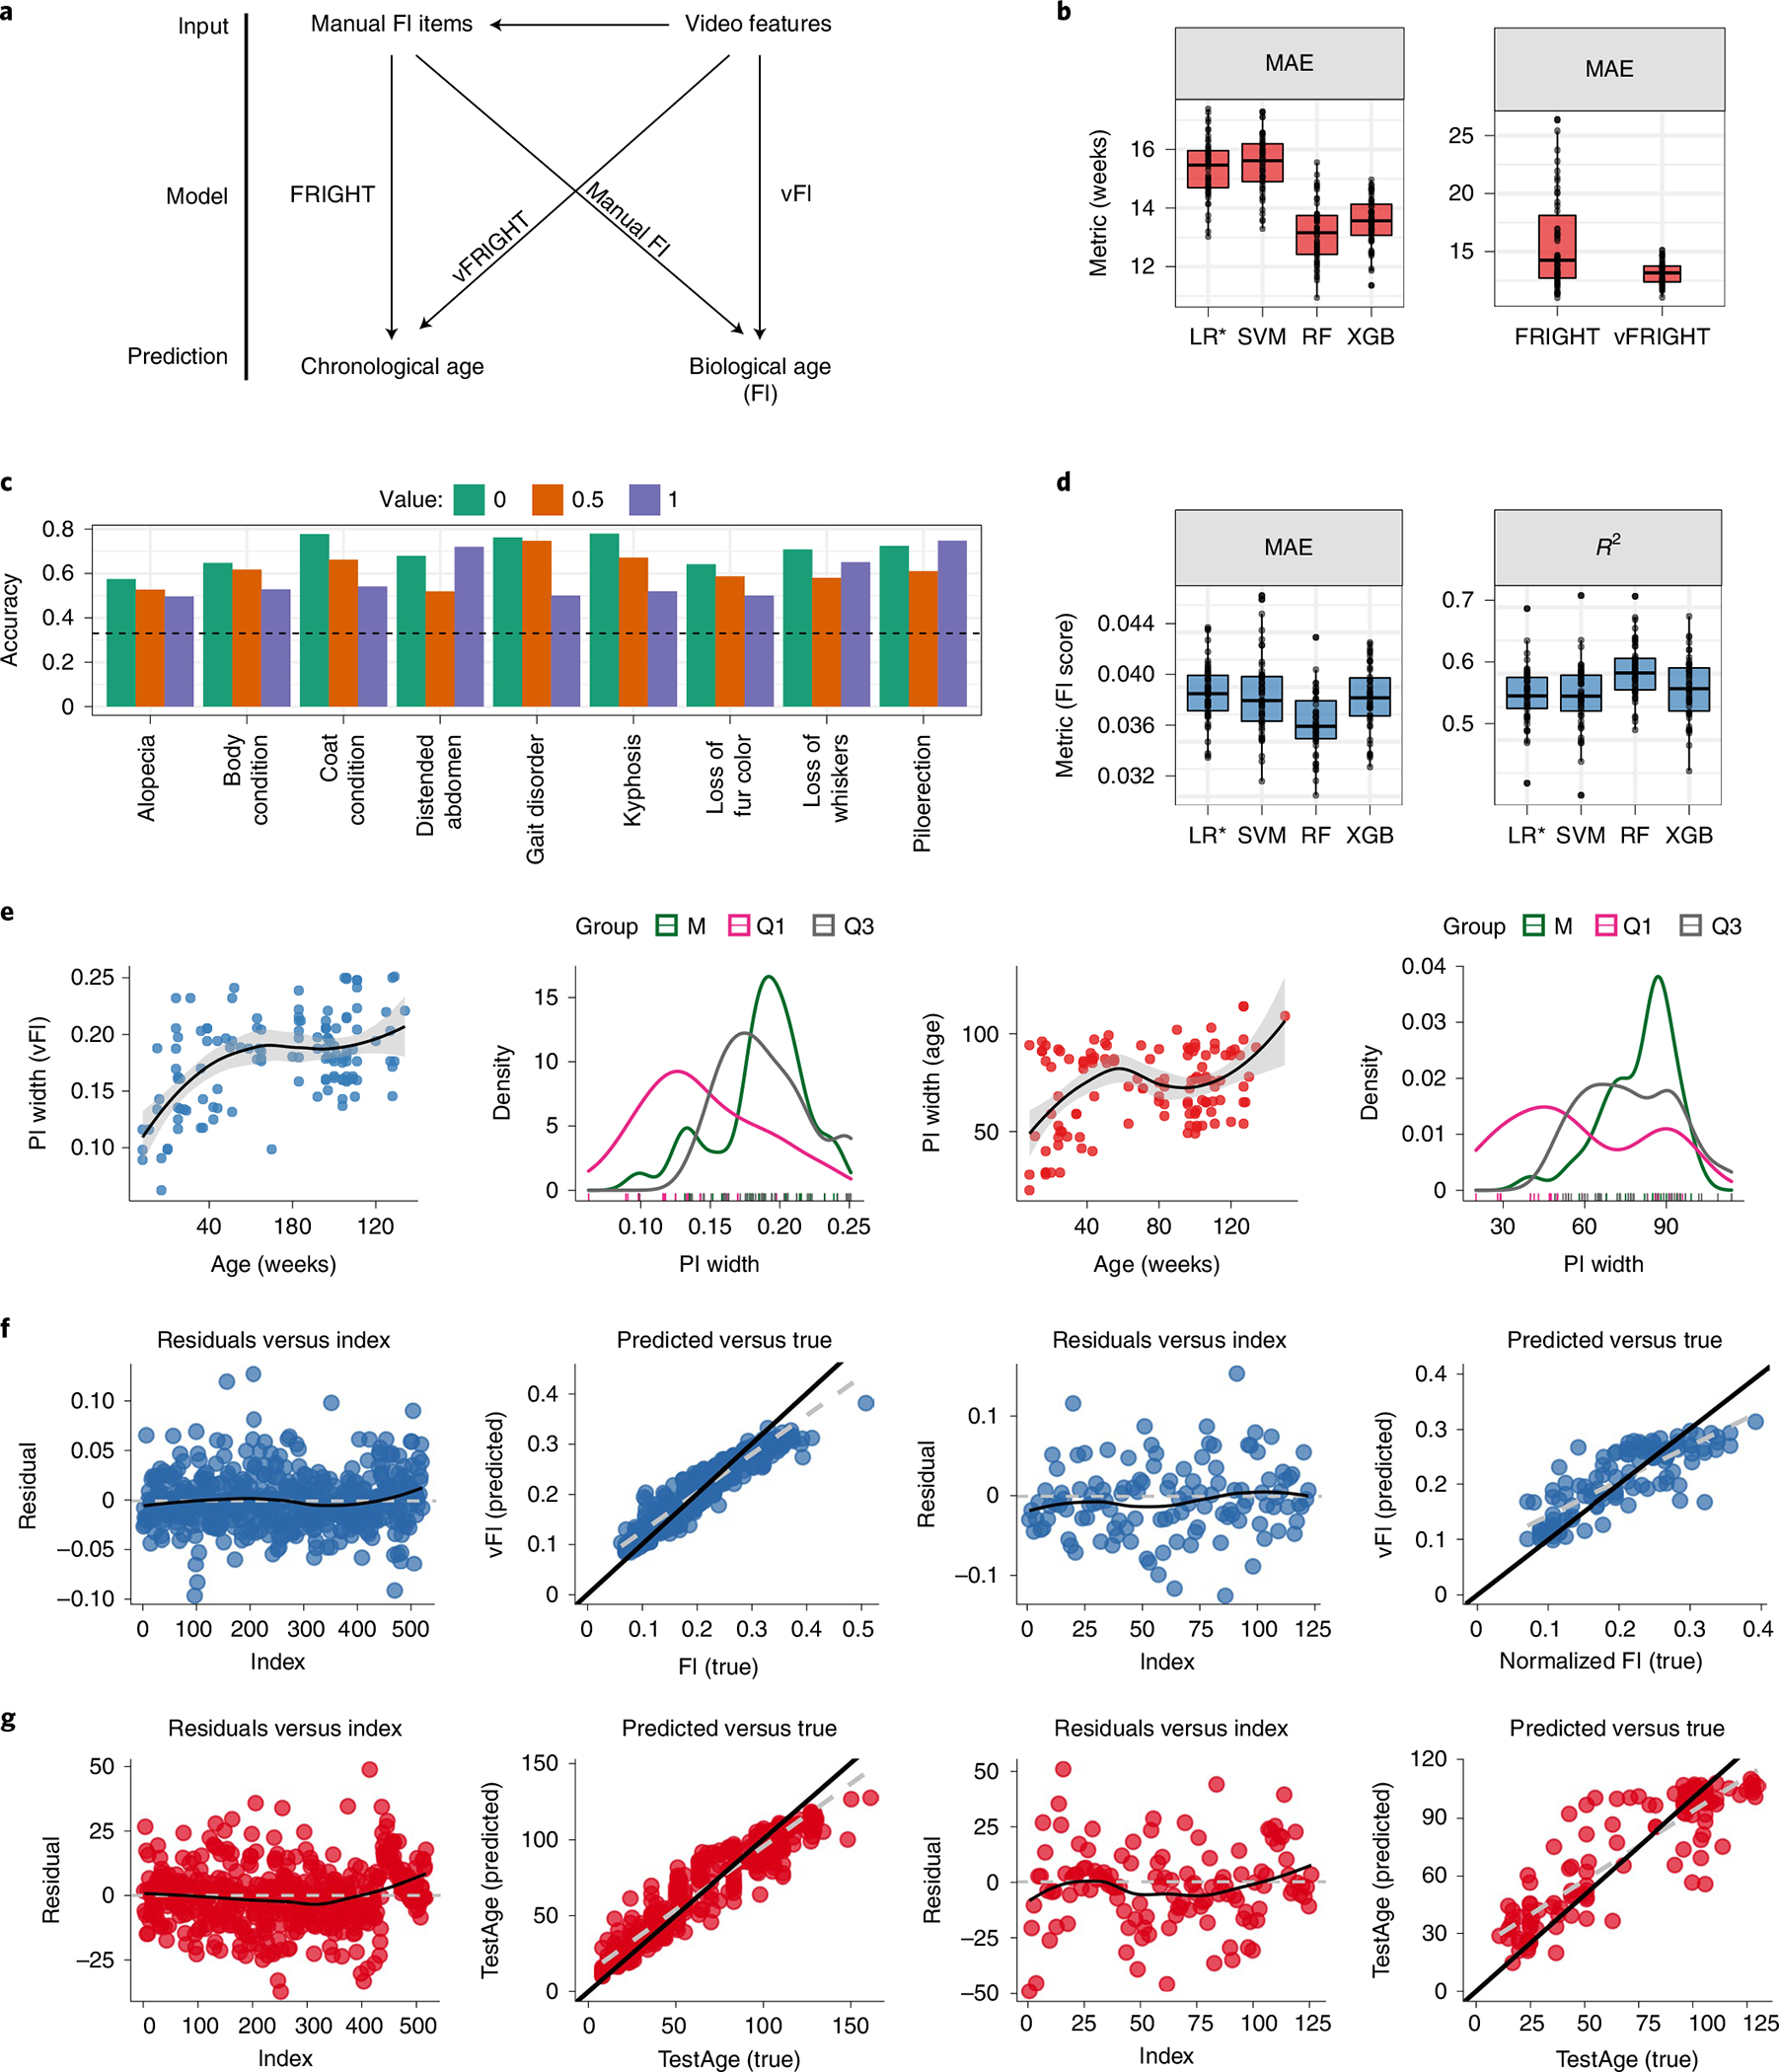
Fig. 4 |. Prediction of age and frailty from video features.

a, A graphical illustration shows the different models we fit. b, Video features are more accurate in predicting age than clinical frailty index items. Comparison among four models (LR*, SVM, RF and XGB) show that the RF predicted age on unseen future data better than other models with a lower MAE ( independent train–test splits, , ) when compared using repeated-measures ANOVA. We then compared the performance of RF models using frailty parameters (FRIGHT) and video-generated features (vFRIGHT) in predicting age. vFRIGHT had a superior performance ( independent train–test splits, , , using repeated-measures ANOVA) with a lower MAE (13.1 ± 0.99 weeks) compared to the FRIGHT clock using FI items (15.7 ± 4 weeks). c, The performance of our ordinal regression models (classifiers) in terms of accuracy (accurately predicting the value of the frailty parameter in the test using the model trained on the training data). The black dotted line superimposed on the plot shows the accuracy that one would obtain if one guessed the values instead of using the video features. We found that the video features encode useful information that improves the models’ ability to predict frailty parameter values accurately. d, Comparison among four models (LR*, SVM, RF and XGB) show that the RF regression model predicted FI score on unseen future data better than all other models, with a lowest MAE ( independent train–test splits, , ) and highest (, ) when compared using repeated-measures ANOVA. e, Uncertainty in predicting age (red) and FI score (blue) plotted as a function of age (weeks). The black curve shows the loess fit. These plots show less uncertainty in predicting age and FI scores for very young mice. We plot the distributions of PI widths and find that the PI widths for predicting age are wider (increased uncertainty in predictions) for mice belonging to the M age group. Similarly, the PI widths for predicting FI scores increase with age in our data. The shaded gray region is the 95% confidence interval for predicted values from the fitted linear model. f, The residuals versus the index and predicted FI score versus true for training (columns 1 and 2; residual s.e. 0.020(0.001), difference in slopes (black versus gray) = 0.23) and test sets (columns 3 and 4; residual s.e. 0.036, difference in slopes (black versus gray) = 0.37) for the RF model. We calculated the difference in the slopes between the diagonal line (black) and gray line. g, The residuals versus the index and predicted age versus true for training (columns 1 and 2; residual s.e. 9.051(1.585), difference in slopes (black versus gray) = 0.17) and test sets (columns 3 and 4; residual s.e.14.27, difference in slopes (black versus gray) = 0.29) for the RF model. The train–test splits in f and g are independent of each other. In b,d, the lower and upper hinges correspond to the first and third quartiles (the 25th and 75th percentiles), respectively, the line in the middle corresponds to the median, the upper (lower) hinge extends from the upper (lower) hinge to the largest (smallest) value not bigger (smaller) than 1.5 × IQR.
