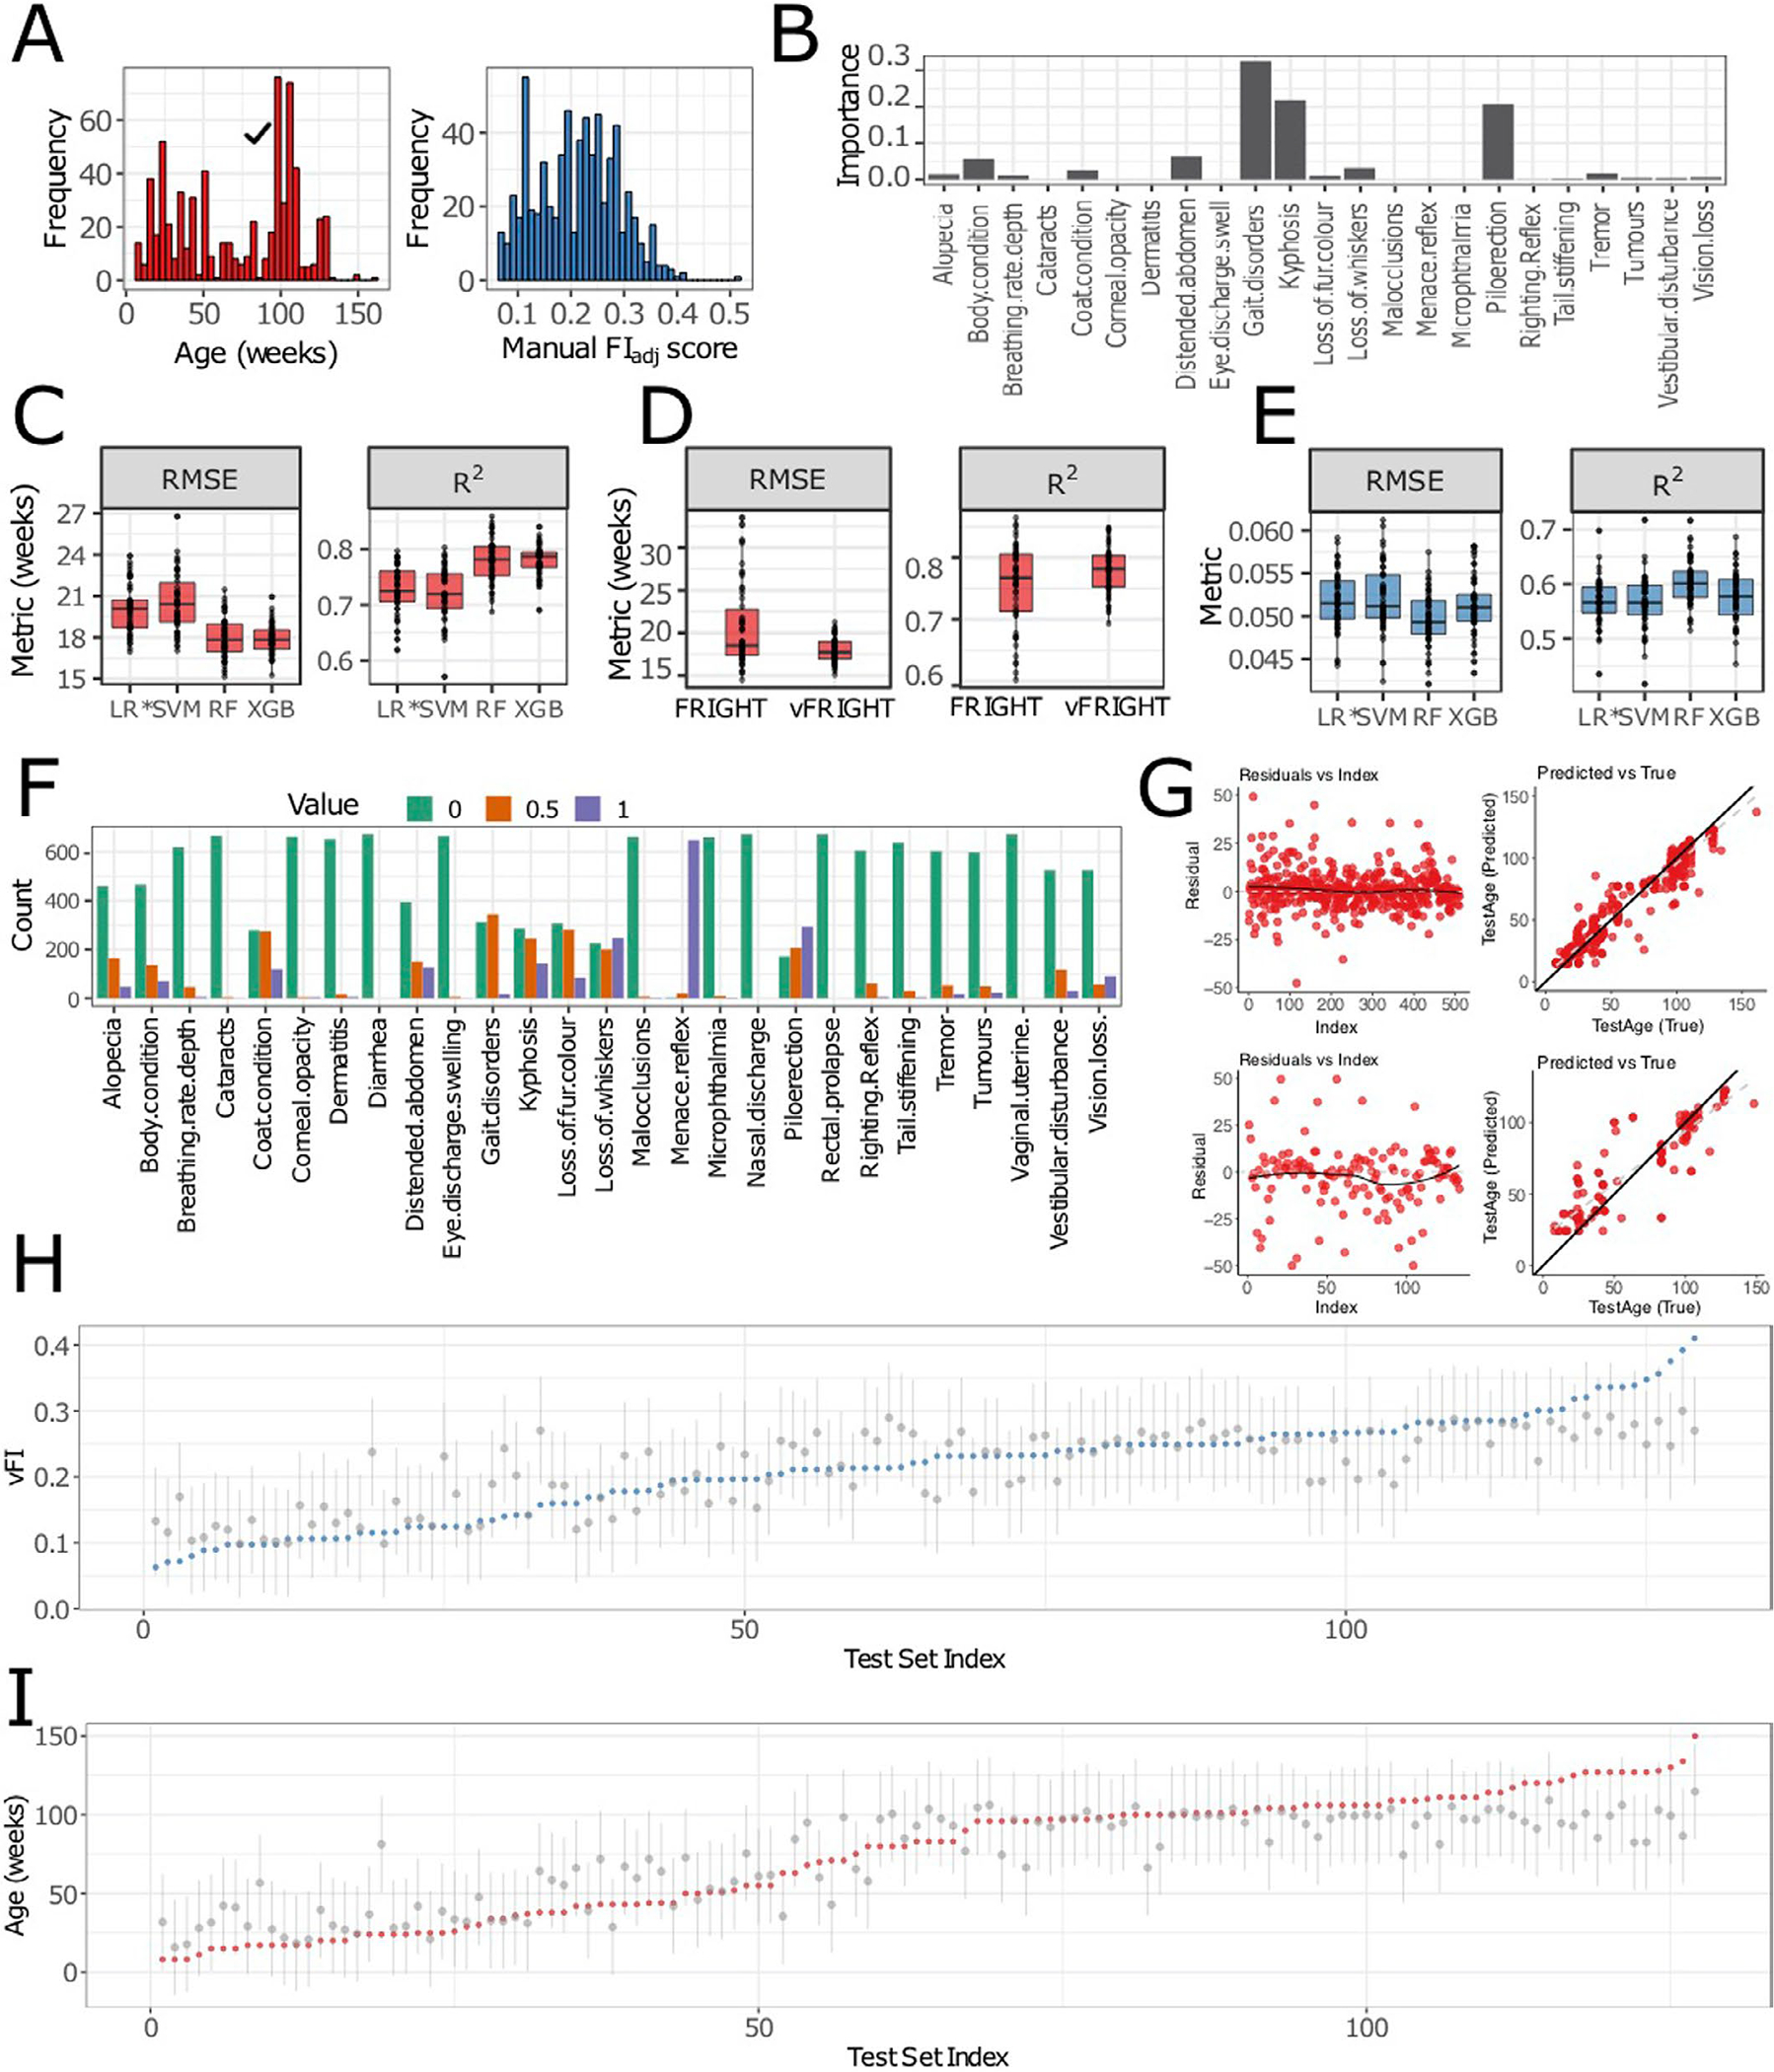
Extended Data Fig. 2 |. Detailed modeling analysis.

A, The distribution of age across 643 data points (533 mice). The distribution of manual FIadj scores across 643 data points (533 mice). B, To determine the contributions of frailty parameters in predicting Age, we calculated the feature importance of all frailty parameters. We discover that gait disorders, kyphosis and piloerection have the highest contributions. C, The random forest regression model performed better than other models with the lowest root-mean-squared error (RMSE) (n = 50 independent train-test splits, p < 2.2e − 16, F3,147 = 59.53) and highest R2 (p < 2.2e − 16, F3,147 = 58.14) when compared using repeated-measures ANOVA. D, The vFRIGHT model performed better than the FRIGHT model with a lower RMSE (n = 50 independent train-test splits, RMSEvFRIGHT = 17.97 ± 1.44, RMSEFRIGHT = 20.62 ± 4.78, p < 6.1e − 7, F1,49 = 32.84) and higher R2 (RMSEvFRIGHT =0.78 ± 0.04, RMSEFRIGHT = 0.76 ± 0.07, p < 2.1e − 8, F1,49 = 44.54) when compared using repeated-measures ANOVA. E, The random forest regression model for predicting FI score on unseen future data performed better than all other models, with a lowest root-mean-squared error (RMSE) (n = 50 independent train-test splits, p < 8.3e − 14, F3,147 = 26.62) and highest R2 (p < 4.7e − 14, F3,147 = 27.2). F, The plot shows the counts distribution (0 - green, 0.5 - orange, 1 - purple) for individual frailty parameters— for many parameters such as Nasal discharge, Rectal prolapse, Vaginal uterine and Diarrhea, the proportion of 0 counts is 1 (p0 = 1). Similarly, Dermatitis, Cataracts, Eye discharge swelling, Microphthalmia, Corneal opacity, Tail stiffening and Malocclusions have p0 > 0.95. G, The residuals versus the index and predicted versus true for training (Column 1; residual standard error = 8.5, difference in slopes (black vs gray) = 0.11) and test sets (Column 2; residual standard error = 15.87, difference in slopes (black vs gray) = 0.30) for the model that predicts Age using frailty index items for both training and test data. H, I, Out-of-bag (OOB) error based 95% prediction intervals (PIs) (gray lines) quantifying uncertainty in point estimates/predictions (gray dots). There is one interval per test mouse (n = 107 unique mice, the test data contains some repeats of the same mice tested at different ages) and approximately 95% of the PI intervals contain the correct Age (red dots) and FI scores (blue dots). We ordered the x-axis (Test set index) in ascending order (from left to right) of the actual age/FI. The average PI width for all test mouse’s predicted FI score is 0.18 ± 0.04 (resp. 71.96 ± 18.52 for the predicted Age), while the PI lengths range from 0.08 to 0.29 (resp. 28 to 113 for Age). n (C, D and E), the lower and upper hinges correspond to the first and third quartiles (the 25th and 75th percentiles) respectively, the line in the middle corresponds to the median, the upper (lower) hinge extends from the upper (lower) hinge to the largest (smallest) value not bigger (smaller) than 1.5 × IQR where IQR is the interquartile range.
